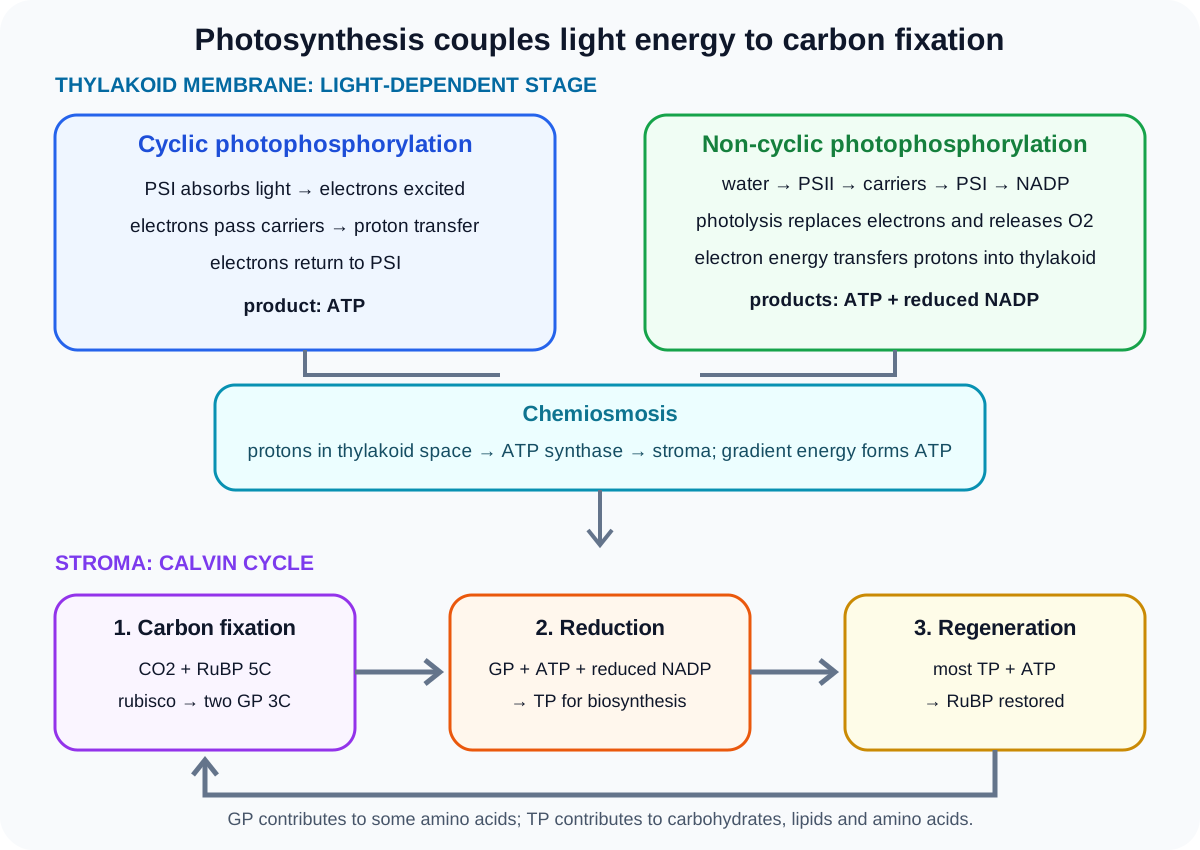
Photosynthesis is Cambridge International Biology 9700 Topic 13. It links chloroplast structure, pigment evidence, cyclic and non-cyclic photophosphorylation, chemiosmosis, the Calvin cycle and limiting factors. Theory owns the energy-transfer mechanisms, calculations and data interpretation; chromatography execution, chloroplast-suspension handling and whole-plant investigation technique remain in the dedicated practical hub.
1. Chloroplast structure and compartmentation
A chloroplast is enclosed by a double-membrane envelope. Inside, thylakoid membranes form flattened sacs with internal thylakoid spaces. Stacks of thylakoids are grana, connected by intergranal lamellae. The surrounding fluid is the stroma.
The thylakoid membrane contains photosynthetic pigments, electron carriers and ATP synthase. Its large folded area supports many light-dependent reaction complexes. The membrane separates the thylakoid space from the stroma, allowing a proton gradient to form.
The stroma contains enzymes for the light-independent Calvin cycle, including rubisco. Chloroplast DNA and ribosomes support production of some chloroplast proteins. In an electron micrograph, identify envelope, grana, lamellae, stroma and possible starch grains from boundaries and density, not colour.
2. Pigments and light absorption
Chlorophyll a, chlorophyll b, carotene and xanthophyll occur in thylakoids. Each pigment absorbs a characteristic range of wavelengths. Together they broaden the light energy that a chloroplast can capture.
Chlorophyll a participates directly in photosystem reaction centres. Accessory pigments absorb wavelengths less strongly absorbed by chlorophyll a and transfer excitation energy within the photosystem. Carotenoids also contribute to light capture and can help protect photosynthetic structures from excessive excitation.
Leaves appear green because green wavelengths are absorbed less strongly and are reflected or transmitted more than red and blue wavelengths. This appearance does not mean green light is never absorbed.
3. Absorption and action spectra
An absorption spectrum shows how strongly a pigment or pigment mixture absorbs different wavelengths. Separate pigment curves reveal complementary absorption ranges. An action spectrum shows the rate or effectiveness of photosynthesis across wavelengths.
Peaks in an action spectrum should broadly correspond to wavelengths strongly absorbed by photosynthetic pigments. The curves need not match exactly because several pigments contribute, energy transfer is not identical at all wavelengths, and the measured photosynthetic response includes processes beyond absorption.
Check this topic from memory
Attempt the matching topic bank before reopening the notes. Use each missed idea to decide what to review next.
When comparing spectra, read wavelength and response axes, locate peaks and troughs, and connect similarities to pigment contribution. Do not claim causation from one matching point alone.
4. Chromatography and Rf evidence
Chromatography separates chloroplast pigments because they differ in solubility in the mobile solvent and attraction to the stationary phase. A concentrated pigment extract is placed near the origin. As solvent moves, pigments travel different distances and form separate spots or bands.
The Rf value is the distance travelled by the centre of a pigment spot divided by the distance travelled by the solvent front, both measured from the origin. It has no unit and should lie between 0 and 1 when measured correctly.
Identification compares colour and Rf with standards obtained under the same conditions. Solvent, stationary phase and temperature affect movement, so a remembered Rf from different conditions is weak evidence. Theory owns the calculation and inference; solvent safety, spotting and chamber technique remain practical skills.
5. Photoactivation and photosystems
A photosystem contains pigment molecules associated with proteins in the thylakoid membrane. Absorbed light energy is transferred to reaction-centre chlorophyll. Photoactivation raises electrons to a higher energy level, and an electron acceptor receives the energetic electrons.
Photosystem I and photosystem II are named PSI and PSII. The numbering does not describe the sequence in non-cyclic flow: PSII acts before PSI. The energy in excited electrons can be transferred through an electron transport chain and used to build a proton gradient.
6. Cyclic photophosphorylation
Cyclic photophosphorylation uses PSI only. Light photoactivates PSI chlorophyll and energetic electrons leave the reaction centre. They pass through electron carriers, releasing energy that supports proton transfer across the thylakoid membrane.
The electrons return to PSI, so their path is cyclic. Protons return to the stroma through ATP synthase and ATP is produced. Cyclic flow does not use PSII, does not photolyse water and does not produce reduced NADP or oxygen.
Its product is ATP, which can supplement the energy required for chloroplast metabolism, including the Calvin cycle.
7. Non-cyclic photophosphorylation
Non-cyclic photophosphorylation uses PSII and PSI. Light photoactivates chlorophyll in PSII and energetic electrons leave. The oxygen-evolving complex catalyses photolysis of water, producing replacement electrons, protons and oxygen.
Electrons from PSII pass through an electron transport chain toward PSI. Their energy is used to transfer protons from the stroma into the thylakoid space. Light then photoactivates PSI, raising the electrons to a higher energy level again. These electrons ultimately support reduction of NADP in the stroma.
The electrons do not return to their original chlorophyll. Water supplies the replacement electrons, reduced NADP receives reducing power, and oxygen is released from water.
8. Chemiosmosis in thylakoids
Photolysis contributes protons within the thylakoid space, and electron-transfer energy drives further proton movement across the thylakoid membrane. The resulting electrochemical gradient stores potential energy.
Protons return from the thylakoid space to the stroma by facilitated diffusion through ATP synthase. This flow provides energy to phosphorylate ADP and form ATP. The syllabus requires the overall carrier chain and ATP synthase roles, not identities of individual electron carriers or structural detail of ATP synthase.
ATP and reduced NADP carry energy and reducing power from the light-dependent stage to the Calvin cycle. They are products for use, not permanent stores.
9. Carbon fixation in the Calvin cycle
The Calvin cycle occurs in the stroma. Rubisco catalyses combination of carbon dioxide with the five-carbon acceptor ribulose bisphosphate, RuBP. The unstable six-carbon product forms two molecules of the three-carbon compound glycerate 3-phosphate, GP.
This is carbon fixation because inorganic carbon dioxide becomes part of an organic compound. Rubisco is the catalyst and RuBP is the carbon dioxide acceptor. Neither is consumed permanently if the cycle continues.
10. Reduction to triose phosphate
GP is reduced to triose phosphate, TP, using ATP and reduced NADP supplied by the light-dependent stage. ATP supplies energy, while reduced NADP supplies hydrogen or reducing power. Oxidised NADP and ADP can return to light-dependent processes.
Some TP leaves the cycle and contributes carbon to other organic molecules. Most TP is retained to regenerate RuBP, so a continuous cycle requires both output and acceptor replacement.
Calling this stage light-independent does not mean it can continue indefinitely in darkness. It depends on ATP and reduced NADP made by light-dependent reactions.
11. RuBP regeneration and biosynthesis
ATP supplies energy for reactions that rearrange TP and regenerate RuBP. Regeneration allows rubisco to accept more carbon dioxide. If RuBP is not regenerated, fixation stops even if carbon dioxide remains available.
Calvin-cycle intermediates feed biosynthesis. GP can contribute to production of some amino acids. TP can be used to produce carbohydrates, lipids and amino acids. The official boundary limits named intermediate products to these relationships, so an unnecessary catalogue of every metabolic pathway is not required.
12. Limiting factors
A limiting factor is the factor in shortest effective supply relative to the requirements of the process, so it constrains the rate. Light intensity, carbon dioxide concentration and temperature are named examples.
At low light intensity, increasing light raises photoactivation and light-dependent product supply, so rate can rise. A plateau occurs when another factor becomes limiting. Raising carbon dioxide can increase carbon fixation until light, temperature or another factor constrains the rate.
Temperature affects enzyme-controlled reactions. Increasing temperature can raise rate toward an optimum through greater kinetic energy and productive collision frequency. Above the optimum, enzyme and membrane disruption reduces rate. The limiting factor can change as conditions change, so one graph region should not be extrapolated without checking the new constraint.
13. Redox-indicator investigations
Isolated chloroplast suspensions can reduce DCPIP or methylene blue during light-dependent electron transfer. DCPIP loses its blue colour when reduced. A shorter decolourisation time or faster absorbance decrease indicates a faster measured reduction rate when chloroplast concentration, indicator volume, temperature and endpoint are controlled.
Light intensity can be varied while controlling wavelength and temperature. Wavelength can be varied with filters while controlling incident intensity as carefully as possible. Dark or heat-treated chloroplast controls distinguish light-driven biological reduction from background colour change.
The indicator is an artificial electron acceptor and the endpoint is a proxy for light-dependent activity, not a complete direct measurement of carbohydrate production.
14. Whole-plant investigations
Whole plants, including aquatic plants, can be used to investigate light intensity, carbon dioxide concentration or temperature. Oxygen production can be estimated from collected gas volume or an oxygen sensor. Counting bubbles is less reliable because bubble size varies.
Only one independent variable should be deliberately changed. Plant size or area, acclimation time, carbon dioxide supply, wavelength, temperature and measurement interval may need control. Repeats reveal biological variation.
Net gas exchange reflects photosynthesis and respiration. At low light, respiration can offset much of the oxygen produced, so the observed rate is not automatically gross photosynthesis. Apparatus execution and risk assessment remain in the practical hub; theory owns variable logic, curve interpretation and mechanism.
Worked application: combining spectrum and limiting-factor evidence
A chloroplast suspension reduces DCPIP quickly under blue light, slowly under green light and quickly again under red light when incident intensity and temperature are controlled. This pattern matches strong absorption by chloroplast pigments in blue and red regions and weaker absorption in green. Doubling carbon dioxide concentration does not change DCPIP reduction because this assay mainly tracks light-dependent electron transfer rather than Calvin-cycle carbon fixation. In a whole aquatic plant under the same light, extra carbon dioxide increases oxygen production at intermediate intensity but not at very low intensity, showing that carbon dioxide becomes useful only after light is no longer the dominant limiting factor.
Common misconceptions and corrections
Putting the Calvin cycle in thylakoid spaces. It occurs in the stroma.
Calling a granum one thylakoid. A granum is a stack.
Saying pigments absorb all wavelengths equally. Each has a characteristic spectrum.
Calling an action spectrum a pigment absorption measurement. It measures photosynthetic response.
Identifying pigments from colour alone. Use Rf under matched conditions as additional evidence.
Measuring Rf from the paper edge. Measure both distances from the origin.
Giving Rf a unit. It is a ratio.
Assuming PSI acts first because it is numbered I. PSII precedes PSI in non-cyclic flow.
Putting PSII in cyclic photophosphorylation. Cyclic flow uses PSI only.
Saying cyclic flow produces reduced NADP. It produces ATP only in this account.
Saying oxygen comes from carbon dioxide. It is released from water during photolysis.
Saying photolysis replaces PSI electrons directly. Water replaces electrons lost from PSII.
Saying electron carriers must be named. Their individual identities are excluded.
Saying protons diffuse through the thylakoid lipid freely. They return through ATP synthase.
Calling RuBP the enzyme. Rubisco is the enzyme; RuBP is the acceptor.
Saying one carbon dioxide directly forms one stable 6C sugar. It yields two GP molecules after fixation.
Saying GP is oxidised to TP. GP is reduced using reduced NADP and ATP.
Using every TP molecule for sugar. Most supports RuBP regeneration.
Calling the Calvin cycle permanently independent of light. It depends on light-stage products.
Saying a plateau proves photosynthesis stopped. Another factor may limit the rate.
Calling DCPIP reduction direct glucose measurement. It is a light-dependent proxy.
Treating bubble count as exact oxygen volume. Bubble size varies.
Assessment guidance
Anchor each event to thylakoid membrane, thylakoid space or stroma. Compare cyclic and non-cyclic flow by photosystems, electron source and destination, and products. Chemiosmosis answers need electron energy, proton transfer, a membrane gradient and ATP-synthase return in sequence. Track carbon through RuBP, GP and TP while assigning ATP and reduced NADP correctly. In spectra, cite wavelength and response from both axes. For limiting-factor graphs, identify the currently limiting factor before predicting an intervention. Investigation answers must name the measured proxy, controls and alternative explanations while leaving apparatus execution to the practical hub.
Retrieval practice
Label a chloroplast micrograph and assign every reaction to a compartment. Draw separate cyclic and non-cyclic electron routes with inputs and products, then reconstruct the proton gradient. Track one carbon dioxide molecule through RuBP, GP and TP and show RuBP regeneration. Calculate Rf values from an unfamiliar chromatogram and compare absorption with action spectra. Finish by interpreting three limiting-factor graphs and designing controls for DCPIP and whole-plant investigations.