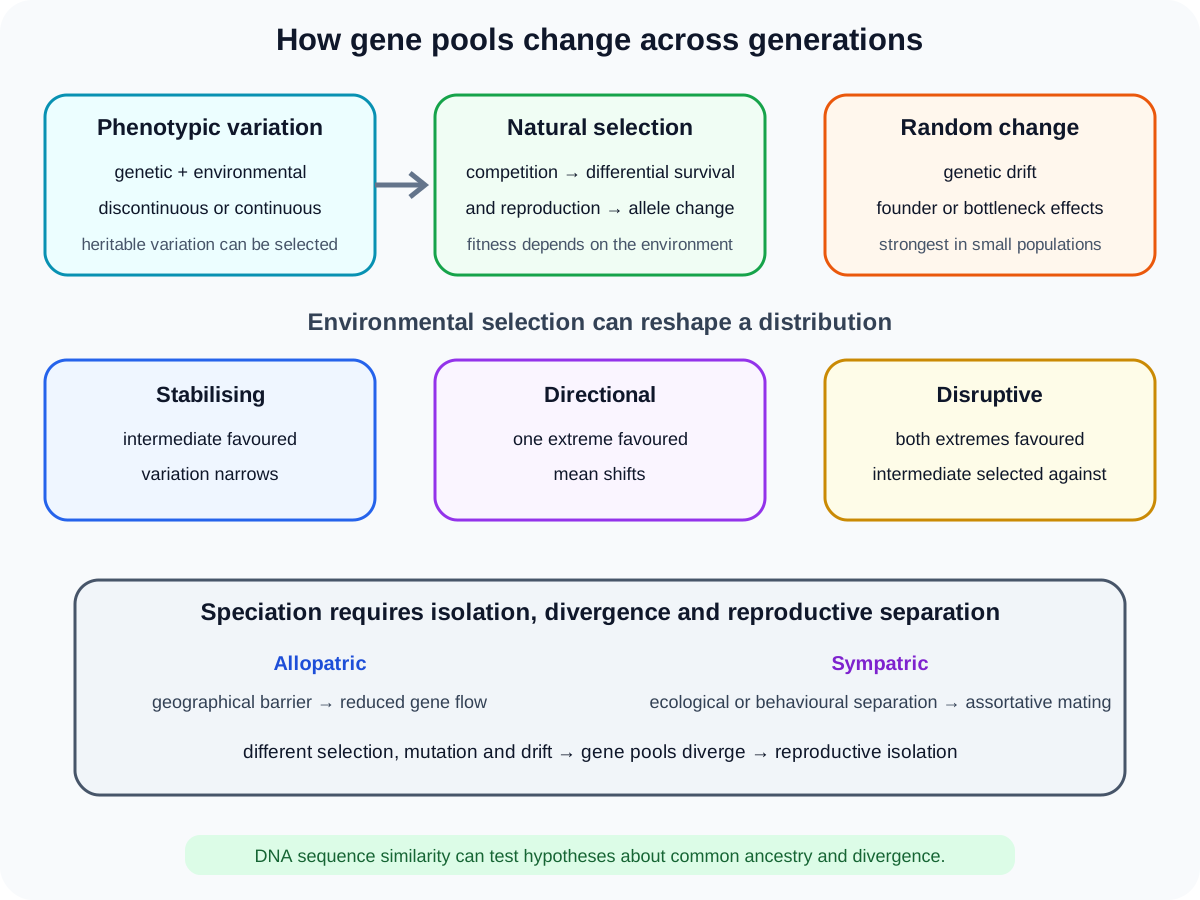
Selection and Evolution is Cambridge International Biology 9700 Topic 17. It connects genetic and environmental variation to statistical comparison, natural and artificial selection, allele-frequency change, Hardy-Weinberg calculations, DNA-sequence evidence and speciation. Theory owns population mechanisms, calculations and inference; measurement design and sample collection remain in the dedicated practical hub.
1. Sources of phenotypic variation
Phenotypic variation can arise from genetic factors, environmental factors or their interaction. Genetic differences include alleles, mutation, meiosis and fertilisation. Environmental effects include nutrition, temperature, light, disease, activity and experience.
Some traits are largely genetic, such as an ABO blood group. Others are strongly environmental within a genotype, such as a plant's growth under different mineral supplies. Many traits, including height and body mass, reflect both inherited potential and environment.
An environmental effect on phenotype does not automatically alter inherited DNA. A genetic predisposition also does not guarantee one phenotype under every environment.
2. Discontinuous and continuous variation
Discontinuous variation places individuals into distinct categories with no intermediates, such as ABO blood groups. It is commonly controlled by one or a few genes, so allele combinations produce separate outcomes. Environmental influence is often relatively limited.
Continuous variation spans a range with many intermediate values, such as height. It is usually polygenic: many loci each contribute a small effect. Environmental factors further broaden the distribution. Large samples commonly form an approximately normal distribution when many small influences combine.
The distinction concerns the observed pattern and genetic basis. Measuring a discontinuous category with numbers does not turn it into continuous variation.
3. Comparing two sample means with a t-test
A t-test evaluates whether the difference between two sample means is large relative to within-sample variation and sample size. Begin with a null hypothesis that the population means do not differ and any observed difference is due to chance sampling.
Use the supplied formula with sample means, spread and sizes. Determine degrees of freedom using the specified test, then compare the calculated t value with the critical value at the chosen probability, commonly 0.05. If calculated t exceeds the critical value, reject the null hypothesis.
A significant result supports a difference under the test conditions; it does not prove the tested factor alone caused it. Sampling, controls and confounding variables still matter. Theory owns the inference, while reliable measurement and sampling remain practical responsibilities.
Check this topic from memory
Attempt the matching topic bank before reopening the notes. Use each missed idea to decide what to review next.
Populations can produce more offspring than available resources can support. Individuals therefore compete in a struggle for existence. Heritable phenotypic variation means some individuals are better suited to the current environment.
Better-adapted individuals are more likely to survive and reproduce. They pass their alleles to offspring, so advantageous alleles become more frequent over generations. Populations evolve; individual organisms do not change their inherited alleles because they need to adapt.
Fitness is relative reproductive success in a stated environment. A phenotype advantageous in one environment may be disadvantageous when conditions change.
5. Stabilising, directional and disruptive selection
Stabilising selection favours intermediate phenotypes and acts against extremes. The mean may remain similar while variation narrows. It occurs when established conditions make the existing intermediate well suited.
Directional selection favours one phenotypic extreme. The distribution mean shifts over generations, as when a changed environment consistently favours greater or smaller values.
Disruptive selection favours both extremes over intermediates. Variation can become bimodal. If extremes also become reproductively isolated, disruptive selection can contribute to divergence, but selection alone does not automatically establish new species.
6. Genetic drift, founder and bottleneck effects
Genetic drift is random change in allele frequencies due to chance sampling of which individuals reproduce. It is strongest in small populations, where each individual represents a larger fraction of the gene pool.
The founder effect occurs when a small number of individuals establish a new population. Their allele frequencies may differ by chance from the source population, and rare alleles can become unusually common or absent.
A bottleneck effect follows a sharp population reduction. The survivors carry only a sample of the original variation. Even if population size recovers, genetic diversity can remain low. These are random processes, unlike selection's consistent association with differential reproductive success.
7. Antibiotic resistance as natural selection
A bacterial population contains heritable variation due to mutation and gene acquisition. An antibiotic kills or inhibits susceptible bacteria. Resistant bacteria survive, reproduce and pass resistance vertically or transfer genes horizontally.
The resistance allele or gene therefore increases in frequency under antibiotic selection. Misuse and incomplete exposure can intensify selection, while transmission spreads resistant strains.
The antibiotic does not instruct bacteria to mutate in the needed direction. Resistance variants arise before or during population growth, and exposure selects them.
8. Hardy-Weinberg principle
The Hardy-Weinberg principle predicts stable allele and genotype frequencies in an ideal population. For two alleles, p plus q equals 1. Expected genotype frequencies are p squared, 2pq and q squared.
The assumptions are a large population, random mating, no selection, no mutation and no migration. These conditions remove systematic or strong random forces that change allele frequency. Departure from expectation can suggest that an assumption is not met, although it does not identify which force without further evidence.
Calculations often begin with the frequency of a recessive phenotype, q squared. Take its square root to find q, subtract from 1 for p, and then calculate heterozygotes as 2pq. Do not confuse allele frequency with the proportion of heterozygous individuals.
9. Principles of selective breeding
Artificial selection begins by identifying individuals with desirable heritable phenotypes. Breeders select them as parents, cross them, evaluate offspring and repeatedly choose the best descendants. Controlled mating increases frequencies of desired alleles over generations.
Selection can reduce genetic diversity and increase harmful recessive homozygosity. Breeding therefore balances gain in a target trait against fertility, disease vulnerability and other performance traits.
The environment still affects measured phenotype, so reliable records and comparable conditions are needed to identify genetic merit.
10. Disease resistance in wheat and rice
Breeders can cross a productive variety with a line carrying resistance to a pathogen. Offspring are screened for resistance and desirable yield or quality traits. Repeated selection and crossing combine resistance alleles with the commercial background.
Resistance reduces crop loss and pesticide dependence, but pathogen populations can evolve. Maintaining multiple resistance sources and genetic diversity can make protection more durable than relying on one genotype everywhere.
11. Inbreeding, hybridisation and maize
Repeated self-fertilisation or close breeding produces homozygous inbred maize lines. Each line becomes genetically uniform but can lose vigour as deleterious recessive alleles become homozygous.
Crossing selected inbred lines produces genetically uniform F1 hybrid seed. Heterozygosity can restore or increase vigour, called hybrid vigour. Farmers must obtain the intended F1 cross because later generations segregate and lose uniformity.
Inbreeding creates stable parental lines; hybridisation combines them. These steps have different purposes and should not be treated as synonyms.
12. Improving dairy-cattle milk yield
Cattle with high milk yield and other desirable records are selected as parents. Bulls can be evaluated through performance of many daughters because males do not express milk yield directly. Artificial insemination can distribute semen from selected males widely.
Repeated selection increases favourable alleles, but breeders should also monitor health, fertility, lifespan and inbreeding. A high-yield phenotype reflects feeding and management as well as genotype, so comparisons require standardised records.
13. Evolution and changing gene pools
Evolution is change in the genetic composition of populations across generations. Selection, mutation, migration and genetic drift alter gene pools. Accumulated changes can cause populations to diverge and eventually form new species from pre-existing species.
Evolution has no planned endpoint. It describes population change under historical environments, chance and inheritance. Modern species are not necessarily steps toward one predetermined ideal.
14. DNA sequence evidence
Homologous DNA sequences can be aligned between species. A greater proportion of matching bases usually supports a more recent common ancestor, while more accumulated differences generally indicate longer divergence.
Multiple genes or genomic regions provide stronger evidence than one short sequence. Mutation rates vary, selection acts differently across genes, and horizontal transfer or incomplete lineage sorting can complicate one locus.
Sequence evidence should be combined with other data and interpreted through a model of inheritance and change. Similarity supports relationship; it does not mean one living species directly descended from the other.
15. Allopatric speciation
In allopatric speciation, a geographical barrier divides a population and reduces gene flow. Different mutations, selection pressures and drift change allele frequencies independently.
Over many generations, genetic differences accumulate. If the populations become reproductively isolated and can no longer exchange genes successfully when contact resumes, they are separate species under the biological species concept.
Geographical separation starts the process but does not by itself prove speciation. Reproductive isolation is the key outcome.
16. Sympatric speciation
Sympatric speciation occurs without a geographical barrier. Ecological separation can arise when groups use different habitats, hosts or resources in the same region. Behavioural separation can occur through different courtship signals or mating times.
Assortative mating reduces gene flow between groups. Selection, mutation and drift then permit divergence. When reproductive isolation becomes established, separate species can form.
The official boundary names ecological and behavioural separation. A complete explanation must connect separation to reduced gene flow and divergent gene pools.
Worked application: Hardy-Weinberg calculation and its limits
In a large sampled population, 9 percent of individuals show a recessive phenotype. If Hardy-Weinberg assumptions apply, q squared is 0.09, so q is 0.30 and p is 0.70. The expected heterozygote frequency is 2 multiplied by 0.70 multiplied by 0.30, giving 0.42 or 42 percent. This calculation does not establish equilibrium by itself. If mating is non-random, migration is substantial or the recessive phenotype changes survival, the assumptions fail and observed frequencies may shift. A later change in allele frequency would need evidence to distinguish selection from drift or migration.
Common misconceptions and corrections
Calling all phenotypic variation genetic. Environment and interaction can contribute.
Calling continuous variation a set of categories. It spans a range.
Saying one gene usually controls continuous variation. It is commonly polygenic.
Using a t-test to prove causation. It tests evidence for a mean difference.
Saying non-significant means identical populations. Evidence was insufficient at the threshold.
Saying individuals evolve during their lives. Populations change across generations.
Calling the environment's action purposeful. Selection has no foresight.
Saying stabilising selection shifts the mean to one extreme. Directional selection does.
Saying disruptive selection favours intermediates. It favours extremes.
Calling genetic drift non-random adaptation. It is chance allele-frequency change.
Saying drift is strongest in huge populations. Its effect is stronger in small ones.
Calling founder and bottleneck effects the same event. One establishes a population; one sharply reduces it.
Saying antibiotics create directed resistance mutations. They select heritable variants.
Using Hardy-Weinberg without checking assumptions. The model has five key conditions.
Equating q with q squared. One is allele frequency; one is genotype frequency.
Calling 2pq the dominant phenotype frequency. It is the heterozygote frequency.
Saying selective breeding has no diversity cost. Repeated selection can narrow variation.
Calling inbreeding hybridisation. They serve distinct maize-breeding steps.
Selecting dairy bulls from their own milk yield. Progeny records are needed.
Calling evolution progress toward perfection. It is gene-pool change over time.
Saying identical sequence means no evolutionary relationship needs inference. Evidence still needs context.
Saying one sequence always gives the true species tree. Loci can differ.
Calling geographical separation complete speciation. Reproductive isolation must develop.
Saying sympatric speciation requires a physical barrier. Ecological or behavioural separation can reduce gene flow.
Assessment guidance
Separate the source of variation from the shape of its distribution. A t-test answer needs a null hypothesis, correct critical comparison and a bounded conclusion. Natural-selection explanations should track heritable variation, competition, differential reproduction and allele-frequency change; keep drift explicitly random. For Hardy-Weinberg calculations, state assumptions and distinguish allele, genotype and phenotype frequencies. Artificial-selection answers should name selection, crossing and repeated evaluation, then address trade-offs. Evolutionary evidence should compare homologous sequence data with limitations. Speciation answers must connect the isolating mechanism to reduced gene flow, divergence and reproductive isolation.
Retrieval practice
Classify examples as genetic, environmental or interactive and as continuous or discontinuous. Complete a t-test decision from supplied statistics. Draw stabilising, directional and disruptive selection outcomes and compare them with founder, bottleneck and drift effects. Solve three Hardy-Weinberg problems after checking assumptions. Reconstruct the three named breeding programmes. Finish by evaluating a DNA alignment and writing parallel causal chains for allopatric and sympatric speciation.