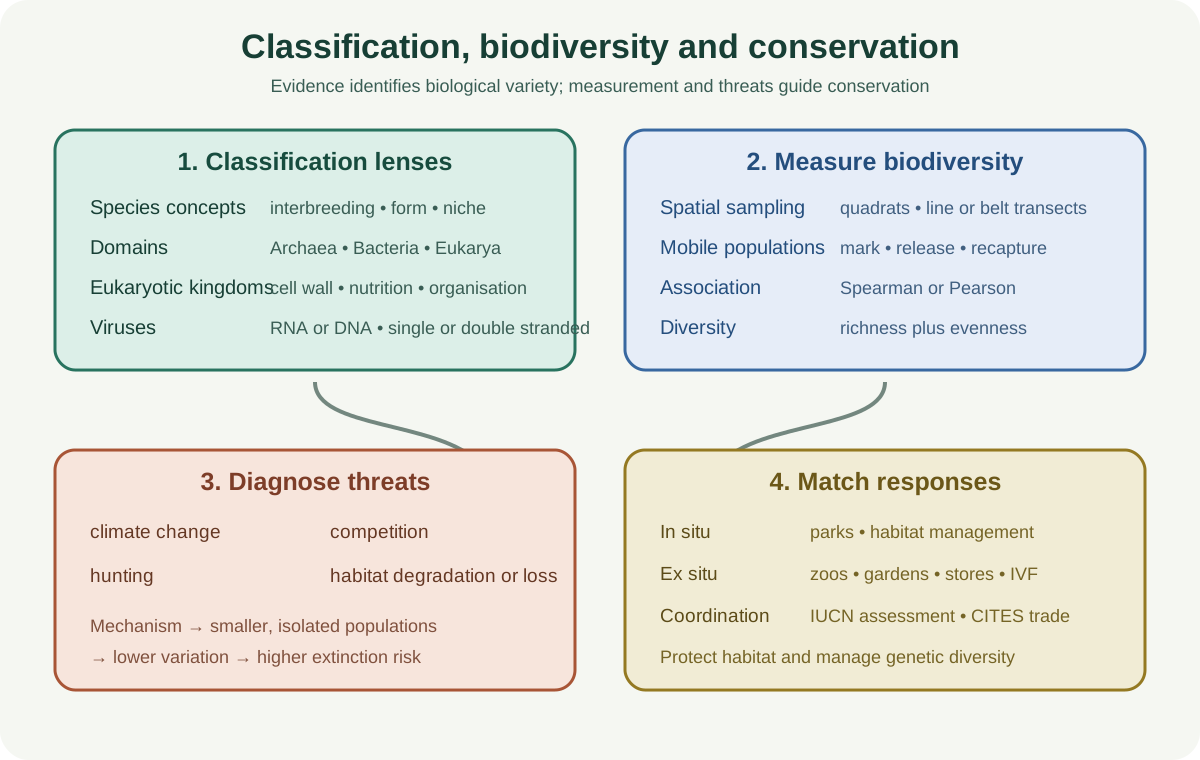
Classification, Biodiversity and Conservation is Cambridge International Biology 9700 Topic 18. It connects ways of defining and grouping organisms with measurements of biological variety, threats to that variety and conservation responses. Theory owns classification decisions, sampling design, calculations, statistical interpretation and evaluation. Safe fieldwork, identification, capture, marking, welfare and primary data collection remain in the dedicated practical hub.
1. Three species concepts
The biological species concept defines a species as a group whose members can interbreed naturally to produce fertile offspring and are reproductively isolated from other groups. It focuses on gene flow. It works well for many sexually reproducing organisms, but cannot be applied directly to fossils or asexual organisms. Testing interbreeding can also be impractical for geographically separated populations.
The morphological species concept groups organisms by observable structural features. It can be used when breeding data are unavailable, including for fossils. However, members of one species can vary by sex, age or environment, while cryptic species can look almost identical.
The ecological species concept identifies a species by its ecological niche, including its role, resource use and interactions. It can help distinguish asexual organisms or similar-looking groups, but niches can overlap and change. No concept solves every classification problem, so biologists choose evidence appropriate to the organisms and question.
2. The three domains
All cellular life is classified into Archaea, Bacteria and Eukarya. Archaea and Bacteria are prokaryotes, while Eukarya contains organisms with eukaryotic cells.
Cambridge limits the distinction between Archaea and Bacteria to three features. Archaeal membrane lipids commonly contain ether links and branched hydrocarbon chains, while bacterial membrane lipids commonly contain ester links and unbranched fatty acids. Their ribosomal RNA base sequences differ. Bacterial cell walls contain peptidoglycan, whereas archaeal cell walls do not.
Both groups lack a membrane-bound nucleus. Do not classify an organism as archaeal merely because it lives in an extreme environment: many archaea do, but habitat is not the specified diagnostic boundary.
3. The Eukarya hierarchy
Within Eukarya, the hierarchy is kingdom, phylum, class, order, family, genus and species. Each lower rank is more specific. A binomial name contains the capitalised genus and lower-case species name, conventionally written in italics.
The hierarchy is nested. Two organisms in the same genus must also share the same family and every higher rank, but organisms in the same family may belong to different genera. Classification is a testable scientific model and can change when new molecular or other evidence changes inferred relationships.
Check this topic from memory
Attempt the matching topic bank before reopening the notes. Use each missed idea to decide what to review next.
Protoctista is diverse. Its organisms are eukaryotic, many are unicellular, and some photosynthesise while others are heterotrophic. This kingdom includes organisms that do not fit the defining combinations of the other three kingdoms.
Fungi are heterotrophs that digest externally and absorb products. Their cell walls contain chitin. Many consist of hyphae forming a mycelium, and carbohydrate is commonly stored as glycogen.
Plantae are multicellular eukaryotes with cellulose cell walls. They commonly contain chloroplasts, photosynthesise and store carbohydrate as starch.
Animalia are multicellular eukaryotes without cell walls. They are heterotrophs that ingest food, commonly show nervous coordination and movement, and store carbohydrate as glycogen.
A single feature is rarely sufficient. For example, being multicellular does not distinguish a plant from an animal or many fungi. Use a combination of cell wall, nutrition, organisation and storage features.
5. Classifying viruses
Viruses are acellular and are not placed in the three cellular domains. Within the official boundary, classify them by whether their genetic material is RNA or DNA and whether it is single-stranded or double-stranded.
Do not add an envelope, host, capsid shape or replication pathway when the question asks for the syllabus classification basis. Those features may be biologically relevant, but they are outside this specified classification boundary.
6. Ecosystems, niches and levels of biodiversity
An ecosystem is the community of organisms in an area together with the abiotic environment and their interactions. A niche describes the role of a species in its ecosystem, including resources used, conditions tolerated and interactions with other organisms.
Biodiversity can be considered at three levels. Ecosystem or habitat diversity concerns the number and range of habitats or ecosystems. Species diversity includes both the number of species and their relative abundance. Genetic diversity is variation in alleles within a species.
Species richness is only the number of species. Species diversity also accounts for evenness. A community dominated by one species may have the same richness as a more even community but lower diversity.
7. Why random sampling matters
A sample is used to infer properties of a larger habitat or population. Choosing attractive, accessible or obviously occupied locations introduces bias. Random sampling gives eligible locations an equal chance of selection and makes the sample more representative.
A coordinate grid and random-number generator can determine quadrat positions. Replication is still needed because one random quadrat may differ greatly from the habitat. Greater sample size usually improves precision, although poor identification or systematic measurement error will not be fixed merely by collecting more biased data.
8. Frame quadrats and transects
A frame quadrat samples organisms in a defined area. It suits plants and slow-moving or sessile organisms. Record frequency, density, abundance or percentage cover according to the question. Percentage cover is useful when individuals overlap or cannot be separated cleanly.
A line transect records organisms touching a line at points along an environmental gradient. It shows changes in occurrence with distance but samples a narrow path. A belt transect uses quadrats along the gradient, either continuously or at stated intervals, and provides abundance or cover across a wider strip.
Choose a method from organism mobility, spatial scale and the question. Quadrat positions can be random for an overall estimate, while a transect is deliberately oriented across a gradient. Calling every placement random would conflict with the purpose of a transect.
9. Mark-release-recapture and the Lincoln index
Mark-release-recapture estimates the population size of a mobile organism. A first sample is captured, counted, marked harmlessly and released. After enough time for mixing, a second sample is captured and the number of marked recaptures is recorded.
Using the symbols supplied in the examination, calculate the Lincoln estimate by multiplying the number marked in the first sample by the total number caught in the second sample, then dividing by the number of marked individuals recaptured.
The estimate assumes a closed population, no loss or overlooking of marks, no effect of marking on survival or capture, complete mixing, equal capture probability and enough recaptures for a useful estimate. Birth, death, immigration or emigration between samples can violate closure. A very small recapture count makes the estimate unstable.
10. Spearman and Pearson correlations
Spearman's rank correlation coefficient tests the strength and direction of a monotonic association using ranks. It is suitable when data are ordinal, not normally distributed or related consistently without forming a straight line. Rank the paired values, calculate rank differences and use the supplied formula.
Pearson's linear correlation coefficient tests the strength and direction of a linear association between two quantitative variables. A curved relationship can be strong biologically but have a misleading Pearson value because it is not linear.
Both coefficients range from negative one to positive one. The sign gives direction and the magnitude gives strength under the relevant model. A significance test evaluates whether the association is unlikely under a null hypothesis of no correlation. Correlation alone does not show that one variable causes the other: a third factor, reverse influence or chance can explain the pattern.
11. Simpson's index of diversity
Simpson's index combines species richness and relative abundance. Use the exact formula supplied in the examination. In the common Cambridge form, values closer to one indicate greater diversity because the probability that two sampled individuals belong to different species is higher.
A community gains diversity when more species are present or abundance becomes more even. Compare values only when identification, effort, area and timing make the samples reasonably comparable. A calculated difference does not by itself establish the environmental cause.
12. Causes of extinction
Climate change alters temperature, rainfall, ocean conditions, seasonal timing and habitat distributions. Species may fail to migrate or adapt quickly enough. Competition can reduce access to food, space or breeding sites, especially when a new competitor enters a community.
Human hunting removes organisms directly and can be especially damaging when reproduction is slow. Habitat degradation reduces habitat quality through pollution, fragmentation or resource loss, while habitat loss removes it. These pressures interact. Fragmentation can create small isolated populations with low genetic diversity, making further environmental change more dangerous.
13. Why biodiversity should be maintained
Biodiversity supports ecosystem processes and services, including pollination, nutrient cycling, soil protection, water regulation and potential resilience to disturbance. Genetic diversity supplies variation that can support adaptation and provides resources for crop breeding or medicine.
Economic, scientific, cultural, aesthetic and ethical reasons also matter. A complete evaluation does not reduce all value to immediate financial benefit. It should connect the type of diversity being protected to consequences at genetic, species or ecosystem level.
14. In situ and ex situ conservation
National parks, marine parks and other conserved areas protect organisms in their habitats. In situ conservation can maintain interactions, selection pressures and natural behaviour. It requires effective boundaries, enforcement, monitoring and cooperation with people who use local resources.
Zoos and botanic gardens maintain living collections outside natural habitats. They can support captive breeding, genetic records, education, research and reintroduction. Small captive populations risk inbreeding, adaptation to captivity and loss of natural behaviour.
Seed banks store seeds under controlled conditions. They preserve plant genetic material compactly, but not every species produces seeds that tolerate drying or freezing. Frozen zoos store cells, gametes, embryos or tissues. Storage preserves genetic material, not an intact ecosystem or learned behaviour.
These approaches complement rather than replace habitat protection. Ex situ material is most useful when a viable habitat and management plan exist for recovery.
15. Assisted reproduction
In vitro fertilisation combines gametes outside the body to produce embryos. Embryo transfer places an embryo into a female reproductive tract. A surrogate carries and gives birth to an embryo that may be genetically unrelated to her.
These methods can increase offspring from valuable or rare genetic combinations and allow material to move without transporting adults. Conservation managers must still avoid overusing a few donors, maintain accurate pedigrees, protect welfare and preserve enough genetic variation for a viable population.
16. Controlling invasive alien species
An invasive alien species is introduced outside its natural range and causes ecological harm. It may compete with native species, prey on them, introduce disease, hybridise with them or alter habitat and food webs. Native organisms may lack effective defences.
Prevention and early detection are usually easier than control after widespread establishment. Physical removal, chemical control or biological control can have non-target effects, so decisions need risk assessment and monitoring. Being non-native alone does not prove a species is invasive; evidence of spread and harm is needed.
17. IUCN and CITES
The International Union for Conservation of Nature assesses extinction risk, maintains the Red List and supplies evidence and guidance for conservation priorities. A Red List category describes assessed risk; it does not itself create legal protection everywhere.
The Convention on International Trade in Endangered Species of Wild Fauna and Flora regulates international trade through agreed listings, permits and restrictions. CITES targets trade pressure across borders. It does not by itself manage every habitat threat or ban all trade in every listed species.
Worked application: choosing evidence and a response
Two equal-area grassland sites are sampled with the same quadrat effort. Site A contains four species with counts 25, 25, 25 and 25. Site B contains four species with counts 85, 5, 5 and 5. They have equal species richness, but Site A has greater evenness and therefore the higher Simpson's index of diversity. If abundance also changes along a moisture gradient, a belt transect can map the pattern and Spearman correlation can test a monotonic association with soil moisture. This remains an association, not proof that moisture alone caused the distribution. If Site B is degraded by an invasive plant, managers need evidence of harm, a controlled removal plan, habitat recovery and repeated monitoring rather than relying on the diversity value alone.
Common misconceptions and corrections
Using the biological species concept for every organism. It cannot be directly tested for fossils or asexual organisms.
Calling two similar-looking organisms one species automatically. Cryptic species can be morphologically similar.
Treating a niche as only the place an organism lives. It includes role, resource use, tolerance and interactions.
Calling Archaea and Bacteria eukaryotes. Both are prokaryotic domains.
Saying archaeal walls contain peptidoglycan. Peptidoglycan is characteristic of bacterial walls.
Classifying archaea only by extreme habitat. Use the specified cellular and molecular differences.
Reversing genus and species formatting. Genus is capitalised; species is lower case.
Classifying viruses into the three cellular domains. Viruses are acellular.
Adding virus features outside the requested boundary. Use nucleic-acid type and strandedness here.
Equating species richness with species diversity. Diversity also includes relative abundance.
Calling a convenient sample random. Random selection requires a chance process.
Assuming a larger sample removes systematic bias. It improves precision, not a flawed method.
Using quadrats for rapidly moving animals without justification. Match the method to mobility.
Calling a transect a random sample of the whole habitat. It deliberately follows a gradient.
Ignoring mark-release-recapture assumptions. Closure, mixing, mark retention and equal capture matter.
Treating the Lincoln result as an exact count. It is an estimate sensitive to recaptures.
Using Pearson for any association. Pearson specifically assesses linear association.
Saying a significant correlation proves causation. Confounding and reverse influence remain possible.
Interpreting every higher Simpson value without checking the formula. Use the supplied definition.
Comparing diversity values from unequal sampling effort uncritically. Methods must be comparable.
Treating habitat degradation and habitat loss as identical. One reduces quality; the other removes habitat.
Saying ex situ conservation preserves an ecosystem. It preserves selected organisms or genetic material.
Assuming seed banks work for every plant. Some seeds do not tolerate storage conditions.
Overusing one successful breeding pair. This can reduce genetic diversity.
Calling every introduced species invasive. Invasiveness requires spread and harm.
Saying IUCN makes all conservation law. It assesses status and provides guidance.
Saying CITES directly protects every habitat. It regulates international trade.
Assessment guidance
When comparing species concepts, state what evidence each uses and one limitation. Classification answers should stay within the named domain, kingdom or virus boundary and use combinations of features. For sampling, justify the method from organism mobility and spatial pattern, then identify bias and assumptions. Show substitutions in Lincoln or diversity calculations and interpret the result in biological context. Match Spearman to ranked monotonic association and Pearson to linear quantitative association, then separate significance from causation. Conservation evaluations should connect a specific threat to a mechanism, compare in situ and ex situ strengths and limitations, and distinguish IUCN assessment from CITES trade regulation.
Retrieval practice
Compare the three species concepts using one organism each. Rebuild the three-domain table from memory and sort unfamiliar eukaryotes by kingdom features. Choose quadrat, line transect, belt transect or mark-release-recapture for four investigations and state assumptions. Interpret one Spearman value, one Pearson scatter plot and two contrasting Simpson values. Finish by tracing one extinction pressure through population consequences and designing a conservation response that combines habitat protection, genetic management and international coordination.