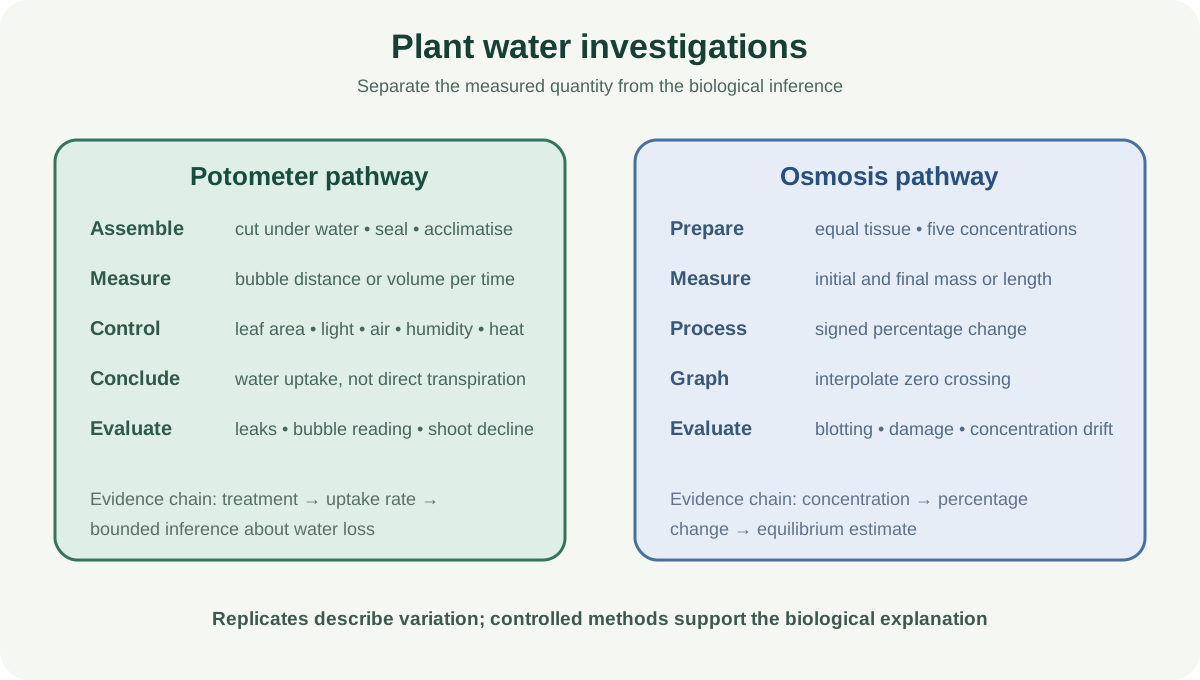
Plant Transport and Water Potential Investigations develops Paper 3 and Paper 5 skills through potometers, plant-tissue osmosis, percentage change and equilibrium estimation. Theory owns cohesion-tension, transpiration and water-potential mechanisms. This practical note owns apparatus assembly, sample standardisation, measurement, controls, risk, data interpretation and evaluation.
1. Know what a potometer measures
A bubble potometer measures water uptake by a cut shoot. Water uptake commonly approximates water loss by transpiration over a short period, but the two are not identical because some absorbed water is used in photosynthesis, growth or maintaining cell turgor.
Measure the distance moved by an air bubble in a capillary over time. If the capillary cross-sectional area is known, multiply distance by area to obtain volume. Divide distance or volume by time for uptake rate. State the actual measured quantity rather than calling it transpiration directly.
A reservoir allows the bubble to be reset without dismantling the apparatus. Mark a fixed start position and keep timing intervals consistent.
2. Assemble the potometer without leaks
Fill the apparatus completely with water before inserting the shoot. Cut the shoot under water with a slanted cut to reduce entry of air and provide a large exposed xylem area. Fit it while submerged where possible.
Seal joints and test that the system is watertight. Introduce one bubble into the capillary by the specified method, then allow the shoot to acclimatise before readings. Dry leaves gently if they became wet during assembly because surface water changes the vapour gradient.
A leaking apparatus measures air entering a joint as well as water uptake. Petroleum jelly or suitable seals can reduce leakage, but excessive material must not block the xylem or capillary.
3. Investigate environmental variables
Light intensity, air movement, humidity and temperature can influence water uptake. Change one variable and standardise the others. For light, vary lamp distance or use measured light intensity while controlling heat with a water screen or LED source. For air movement, standardise fan setting and distance. For humidity, use a controlled enclosure rather than vague labels.
Use at least five values where feasible, replicate readings and allow acclimatisation after each change. Randomising treatment order can reduce a systematic time effect as the shoot deteriorates. Alternatively, use separate comparable shoots and random allocation.
Leaf area strongly affects uptake. Use the same shoot across treatments or measure leaf area and express rate per unit area when comparing shoots.
Check this topic from memory
Attempt the matching topic bank before reopening the notes. Use each missed idea to decide what to review next.
Leaks, changing leaf area, a blocked xylem vessel, temperature drift and shoot deterioration can bias results. Bubble sticking or parallax creates measurement error. A capillary with a narrower bore gives a larger movement for the same water volume, improving sensitivity, but the range must still accommodate the rate.
Use a ruler fixed parallel to the capillary, read at eye level, repeat timings and calculate mean rate. Test seals before data collection. Monitor environmental variables with instruments rather than assuming they remain constant.
A potometer result supports a relationship between treatment and water uptake under the tested conditions. It does not alone prove which stomatal or molecular mechanism caused the change.
5. Design a plant-tissue osmosis investigation
Cut cylinders or chips from the same tissue using one cork borer. Standardise initial length, diameter, surface area, tissue source and whether skin is removed. Blot consistently before weighing so surface solution is not measured as tissue mass.
Place samples into at least five known solute concentrations using equal solution volumes and immersion times at controlled temperature. The solution volume should be large enough that water movement does not substantially change its concentration.
Use independent tissue pieces as replicates at every concentration. Randomly allocate pieces to reduce the chance that tissue position or initial condition is confounded with concentration.
6. Measure mass or length consistently
Record initial mass or length before immersion and final value after equal treatment. Mass is often more sensitive to overall water movement, while length may be suitable when a clear axis is defined. Use the same balance or ruler and precision throughout.
Blot every sample using the same procedure and pressure. Too little blotting leaves external solution; excessive pressing removes tissue fluid or damages cells. Process samples on a fixed schedule so immersion times match.
Inspect tissue for damage. A split or crushed cylinder may have altered permeability and surface area. Record the anomaly and repeat with a new piece rather than quietly replacing the value after seeing the trend.
7. Calculate percentage change
Calculate change as final value minus initial value. Percentage change is change divided by initial value, multiplied by 100. A positive value indicates gain and a negative value indicates loss.
Percentage change makes samples with different initial sizes more comparable. It does not remove all biological variation, so initial dimensions should still be standardised and replicates retained.
Keep the sign. Reporting only absolute change hides the direction of water movement. Show raw initial and final measurements as well as processed percentage values.
8. Estimate the equilibrium concentration
Plot solute concentration on the x-axis and mean percentage change on the y-axis. Draw an appropriate curve or line through the pattern. The concentration where the graph crosses zero percentage change estimates the external concentration at which there was no net mass change.
This is an interpolation, not necessarily one of the tested concentrations. Smaller intervals around the crossing improve resolution. Do not extend a distant line if zero lies outside the data range; repeat with a more suitable concentration range.
At the estimated equilibrium under the experiment's assumptions, tissue and external solution have no net water movement. This can help infer tissue water potential if the solution water potentials are known. Equal mass does not mean individual water molecules stopped moving.
9. Connect water movement to evidence
In a dilute external solution with higher water potential, net water movement into cells can increase mass and turgor. In a concentrated external solution with lower water potential, net movement out can reduce mass and cause loss of turgor.
The graph supports these directions when controls and sample quality are adequate. It does not directly measure membrane channels or pressure potential. Keep the conclusion at the scale of the collected evidence, then use theory to explain it.
Unexpected gains at high solute concentration may arise from dilution error, tissue damage, swapped labels or inconsistent blotting. Investigate method records before proposing a new biological mechanism.
10. Controls, replication and data quality
A distilled-water treatment provides a useful comparison but is part of the concentration series rather than a universal negative control. Standardise solution identity, volume, vessel, time and temperature.
Calculate means from genuine independent tissue samples. Report spread so confidence in the mean can be judged. If error bars overlap, do not use that fact alone as a universal significance test; apply the statistical guidance stated in the question.
Use adequate independent-variable range and intervals. A beautiful graph cannot recover an equilibrium point that was never bracketed by positive and negative changes.
11. Risk and responsible practice
Cutting tools can injure. Use a tile, cut away from hands and use an appropriate tool or cork borer under supervision. Glass capillaries can break and produce sharp edges, so inspect them and handle carefully.
Electrical equipment, lamps and water must be arranged safely. Hot lamps can burn and heat the shoot, confounding a light investigation. Low-risk solute solutions still require correct labelling and spill management.
Use plant material efficiently and dispose of it according to laboratory instructions. Risk assessment should state hazard, probability and severity, then name the precaution.
Worked application: locate a tissue equilibrium point
Potato cylinders placed in 0.20, 0.30, 0.40, 0.50 and 0.60 moles per cubic decimetre sucrose show mean percentage mass changes of plus 8, plus 4, plus 1, minus 3 and minus 7 percent. Plot concentration against mean percentage change and interpolate the zero crossing between 0.40 and 0.50. The estimate is about 0.43 moles per cubic decimetre if the local trend is close to linear. It is not an exact tissue water potential. Repeat with smaller intervals around 0.43, more independent cylinders, controlled temperature and consistent blotting, then use known solution water potentials if the question requires a water-potential estimate.
Common misconceptions and corrections
Saying a potometer directly measures transpiration. It measures water uptake.
Cutting the shoot in air. Air can enter and break the water column.
Calculating percentage change using final mass as denominator. Use initial mass.
Dropping the negative sign. Direction of change matters.
Plotting percentage change on x. Concentration is the independent variable.
Calling the nearest tested value the exact equilibrium. Interpolate the zero crossing.
Extrapolating to zero outside the tested range. Redesign the range.
Saying zero change means water molecules stop. Dynamic movement can continue equally.
Equating equilibrium concentration directly with water potential. A conversion or known values are required.
Using overlap of any error bars as a universal test. Interpret the specified uncertainty measure.
Assessment guidance
For a potometer, state what is actually measured, give a watertight assembly sequence and control environmental variables and leaf area. A method must include acclimatisation, repeat readings and rate units. For osmosis, specify tissue dimensions, solution range and volume, time, temperature, blotting and independent replicates. Show percentage-change direction and denominator. On the graph, identify the interpolated zero crossing and bound the conclusion. Evaluations should connect leaks, sample variation, solution change, timing or blotting to their likely effects and targeted improvements. Safety answers need specific cutting, glass, heat or electrical precautions.
Retrieval practice
Label and assemble a potometer from memory, then list five leak checks and confounders. Design separate light, humidity and air-movement investigations. Calculate distance and volume uptake rates. Plan a five-concentration tissue osmosis method, including random allocation and blotting. Calculate signed percentage changes, graph them and estimate a zero crossing. Finish by writing limitation-effect-improvement chains for both apparatuses.