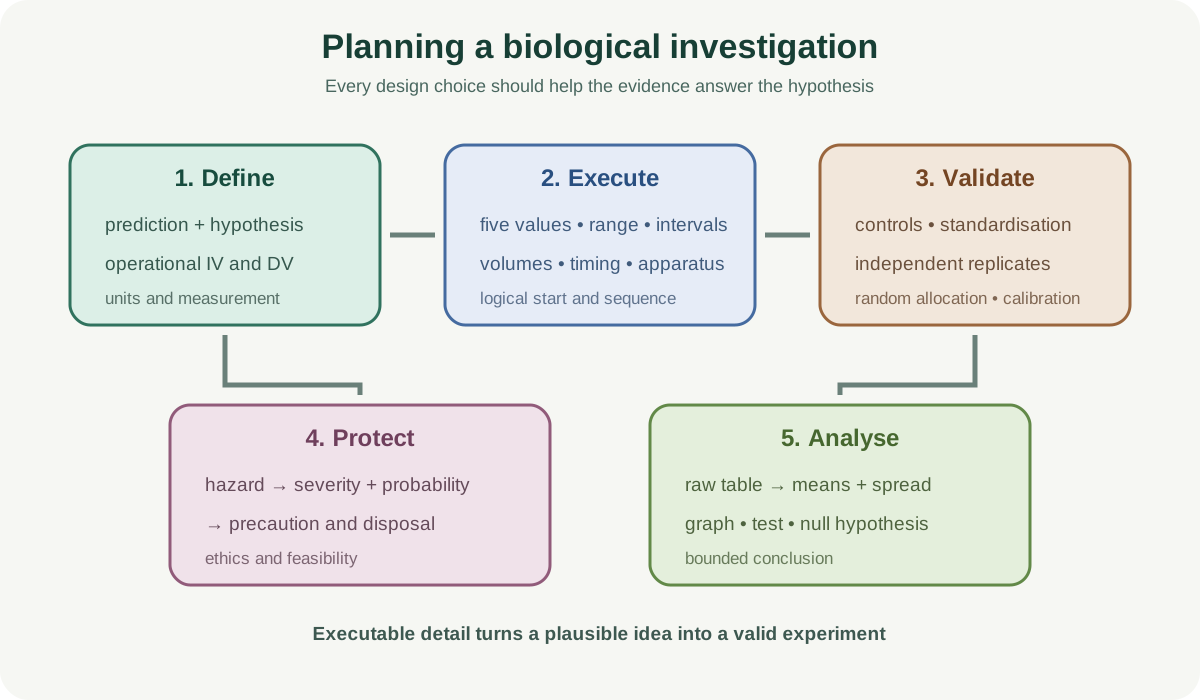
Planning Biological Investigations develops the higher-order practical design assessed in Cambridge Biology 9700 Paper 5 and supports decision-making in Paper 3. The context may be unfamiliar, so a strong plan converts a hypothesis into an executable, safe and valid method. Subject theory supplies the biological rationale; this practical note owns variables, range, measurement, controls, replication, data quality, risk and planned analysis.
1. Turn the prompt into a testable problem
Identify the factor deliberately changed and the outcome measured. State a directional prediction when biological knowledge supports one: as the independent variable changes, the dependent variable is expected to increase, decrease or show an optimum.
Link the prediction to an underlying hypothesis or mechanism. The prediction describes the expected pattern; the hypothesis provides the proposed explanation. Do not write a circular hypothesis such as “temperature affects rate because rate changes with temperature.”
If a precise direction is not justified, state a relationship that can still be tested and explain the competing possibilities. A sketch graph can express a prediction, but axes and expected shape must be clear.
2. Define variables operationally
Name the independent variable with units and state exactly how it will be changed. Name the dependent variable with units and state the apparatus, observation rule or calculation used to measure it.
Identify only key standardised variables that could materially affect the outcome. For each, describe how it will be controlled. “Keep temperature constant” is incomplete; “place all tubes in a thermostatically controlled water bath at 30 degrees Celsius and allow five minutes to equilibrate” is executable.
Do not waste space standardising negligible differences between nominally identical glassware unless the context makes them important.
3. Choose range, intervals and values
Use a minimum of five values of the independent variable. Select a range wide enough to reveal the predicted relationship while remaining safe and biologically relevant. Intervals can be equal when appropriate, but should be denser near an expected threshold or optimum if resolution matters.
A preliminary study can establish useful range, concentration, duration and sampling frequency. Explain what the pilot will decide. “Do a pilot” alone earns little because it does not specify the decision.
Avoid values that create floor or ceiling effects. If every reaction finishes before the first reading, the method cannot distinguish rates. If no treatment produces a measurable response, the range is uninformative.
Check this topic from memory
Attempt the matching topic bank before reopening the notes. Use each missed idea to decide what to review next.
Choose apparatus whose resolution matches the expected change. State volumes, concentrations, durations, temperatures and instrument precision. Read scales consistently and describe calibration or zeroing where relevant.
Prefer objective continuous measurements when feasible, such as gas volume or absorbance, over subjective categories. If a visual endpoint is necessary, define it, standardise lighting and use the same observer or an agreed reference.
For a time course, give measurement intervals and total duration. For a destructive sample, explain how separate specimens are assigned to times. Do not repeatedly sample a system if sampling itself substantially changes it.
5. Build a logical sequence
Write the method in an order another trained person could follow. Include preparation, equilibration, starting the investigation, mixing, timing, measurements, repeats and resetting or cleaning equipment.
If multiple treatments cannot be processed simultaneously, stagger their starts by fixed intervals or randomise order. This prevents later treatments from consistently receiving longer preparation or different room conditions.
Label samples before adding materials. Prevent cross-contamination with clean transfer equipment. State how the independent variable is prepared, including proportional or serial dilution when concentration changes.
6. Use controls that answer a question
A control reveals whether the response depends on the tested component or whether the method can detect a response. A negative control omits the active factor or replaces it with an inert equivalent. A positive control contains a known condition expected to respond.
Procedural controls can reveal solvent, handling or vector effects. Match total volume and treatment steps so the control differs only in the key factor.
Not every lowest independent-variable value is a control. A zero concentration may be both a treatment and a negative control, but its purpose must be stated.
7. Plan genuine replication
Use independent biological replicates at each value. Three or more may be a practical minimum in school experiments, but choose as many as feasible and justify them from biological variation, time and material.
Technical repeats of one sample assess measurement repeatability but do not replace independent organisms, tissues or preparations. Randomly allocate biological units to treatments to reduce systematic differences between groups.
Plan how repeats will be used: calculate a mean, identify spread with standard deviation, standard error or 95 percent confidence intervals, and investigate anomalies. Do not promise to repeat “until consistent,” which encourages selective stopping.
8. Assess accuracy, repeatability and validity
Accuracy concerns closeness to the true value and can be improved by calibration, appropriate apparatus and reduced systematic bias. Repeatability concerns agreement when the same method and conditions are repeated. Validity asks whether the design tests the stated hypothesis.
A method can be repeatable but invalid if a confounding variable changes with the independent variable. It can be valid in principle but imprecise if measurement scatter is large.
Plan a check for instrument calibration, procedural blanks or known standards where suitable. State how anomalies and spread will affect confidence rather than using repeats only to obtain a smoother graph.
9. Prepare a risk assessment
Identify hazards from chemicals, biological materials, heat, electricity, glass and cutting tools. For each, consider severity and probability to judge risk. Then specify precautions that reduce exposure or likelihood.
Examples include eye protection for irritants, low concentrations, water baths instead of naked flames, forceps and cutting tiles, disinfection, hand washing and safe waste disposal. “Wear gloves” is not universally correct; choose protection appropriate to the hazard and task.
Include ethical constraints where living organisms or human information are involved. Minimise harm, use the smallest justified sample, obtain consent where relevant and protect confidential data.
10. Plan the data table
Before collection, design a table with the independent variable in the first column and dependent measurements to the right. Put units in headings, not data cells. Include raw replicates and processed means or rates in separate columns.
Use consistent decimal places for measurements from the same instrument. Leave space for qualitative observations that may explain an anomaly. A table should preserve raw data rather than show only averages.
State the calculation needed, such as mean, percentage change, rate or calibration interpolation, and how significant figures will follow the input precision.
11. Plan the graph and statistics
Put the independent variable on the x-axis and dependent variable on the y-axis. Choose a graph for continuous data, a bar chart for categories and a histogram for frequency data. Include error bars when standard error or confidence intervals are required.
Choose a statistical test from the data and question, not from familiarity. A t-test compares two means under its conditions; chi-squared evaluates categorical frequencies; Spearman assesses ranked monotonic association; Pearson assesses linear association. State the null hypothesis and how calculated evidence will be compared with a significance threshold.
The plan should say how the analysis answers the hypothesis. A test result does not replace the biological pattern or mechanism.
12. Preserve scope and feasibility
Paper 5 plans must fit the stated apparatus and context. Do not assume specialist equipment, unlimited organisms or impossible precision. Use supplied information when the biological context is unfamiliar.
Separate an improvement from an extension. An improvement tests the same question more reliably. An extension changes or adds an independent variable to answer a new question.
Check the completed plan for one-factor change, adequate range, replicates, controls, safe detail and an analysis that can produce the promised conclusion.
Worked application: plan a concentration-rate investigation
Hypothesise that increasing substrate concentration increases initial enzyme rate until active sites become limiting. Prepare at least five substrate concentrations by proportional dilution, keeping total volume constant. Equilibrate substrate and equal enzyme preparations in a thermostatically controlled water bath with the same buffer. Combine them using a fixed start sequence and record product absorbance every 15 seconds for two minutes. Use independently prepared enzyme samples at each concentration, randomise run order and calculate initial gradients, means and spread. Include a zero-substrate control, blank the colorimeter appropriately, assess reagent and glass hazards, and plot mean initial rate against substrate concentration without extrapolating beyond the tested range.
Common misconceptions and corrections
Writing a topic rather than a prediction. Link a defined independent and dependent variable.
Confusing prediction with hypothesis. One states pattern; the other proposes explanation.
Naming variables without units or measurement. Define them operationally.
Saying “control everything.” Select variables that materially affect the outcome.
Listing a control with no method. State how it is standardised.
Using fewer than five values. Cambridge expects at least five in practical decisions.
Choosing an arbitrary range. Use biology, safety and a pilot.
Saying “do a pilot” without purpose. Name what it will determine.
Selecting apparatus without resolution. Match precision to expected change.
Calling a colour endpoint objective automatically. Define and standardise it.
Omitting reaction start and mixing. Timing becomes inconsistent.
Starting more samples than can be measured. Stagger or randomise runs.
Calling the lowest treatment a control automatically. Explain what it controls.
Using technical readings as biological replicates. Independent samples are required.
Repeating until results agree. Predefine replicate number and anomaly handling.
Calling repeatability accuracy. They test different properties.
Assuming close values prove validity. Confounding can remain.
Writing “be careful” for risk. Match hazard, risk and precaution.
Putting units in every table cell. Put them in headings.
Reporting only means. Preserve raw replicates.
Choosing a bar chart for continuous concentration. Use a graph.
Choosing a statistical test before identifying data type. Match test to evidence.
Giving no null hypothesis. Statistical inference needs one.
Planning an unavailable instrument. Respect the supplied apparatus.
Calling a new independent variable an improvement. It is an extension.
Assessment guidance
Paper 5 planning marks reward executable detail and linked reasoning. Start with a prediction, hypothesis and operational variables. Give a minimum five-value range, exact apparatus, volumes, concentrations, timing and a logical start sequence. Standardise key confounders with methods, not labels. Include controls with purposes, independent replication, random allocation and planned means and spread. Risk assessment must connect hazard, probability or severity and precaution. Finish by specifying the raw-data table, suitable graph, calculation or statistical test, null hypothesis and decision. Check that the evidence produced can genuinely answer the question without extrapolation or unmeasured assumptions.
Retrieval practice
Convert three unfamiliar prompts into predictions and hypotheses. Define variables with units and apparatus, then justify five-value ranges. Write an executable method including control, random allocation and independent replication. Build a hazard-risk-precaution table. Design raw and processed data columns, choose a graph and match four data structures to t-test, chi-squared, Spearman or Pearson. Finish by auditing a plan for confounding, feasibility and unsupported conclusions.