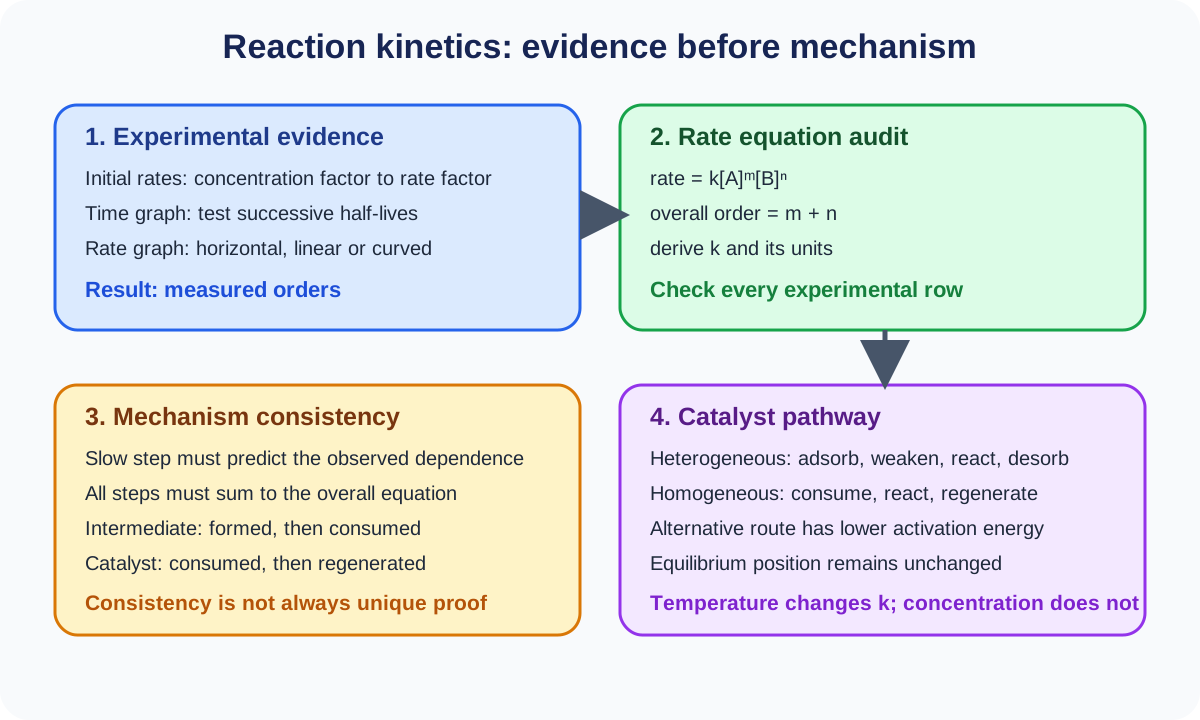
Reaction Kinetics is Cambridge International Chemistry 9701 Topic 8. It connects measured rate with collision frequency, effective collisions, activation energy, Boltzmann distributions, temperature and catalysis. Practical apparatus, variables, timing and data collection remain in the practical hub; this theory note owns particle explanations, graph interpretation and rate calculations.
1. Rate of reaction
Rate of reaction is change in concentration or another measured quantity per unit time. Reactant concentration decreases, while product concentration increases.
Average rate uses change over a stated interval. Instantaneous rate is the gradient of a tangent to a quantity-time curve at one time. Include units derived from the measured quantity and time.
A steep gradient has large rate magnitude. For a reactant graph, the gradient is negative because concentration falls, but reaction rate is commonly reported as a positive magnitude unless a signed rate of change is requested.
2. Measuring a changing quantity
Suitable signals include gas volume, gas pressure, mass, concentration, absorbance or time to a fixed endpoint. The signal must track reaction progress in a known direction.
On a product-volume graph, the curve rises and eventually levels when the limiting reagent is exhausted. The plateau gives final amount, while the gradient gives rate. A higher plateau does not automatically mean a faster initial reaction.
Experimental setup and control belong to the practical hub. In theory, interpret what the chosen signal represents and its limitations.
3. Calculate average rate
Choose two times, subtract the measured values and divide by the time interval. State whether the result represents formation or consumption.
For stoichiometric comparisons, species rates can differ by equation coefficients. In a reaction producing two moles of product for each mole of reactant consumed, raw concentration changes need coefficient interpretation if one common reaction rate is requested.
Do not calculate one divided by time unless every endpoint corresponds to the same fixed extent of reaction.
4. Calculate instantaneous rate
Draw a tangent at the requested point. Choose two widely separated points on the tangent, calculate vertical change divided by horizontal change and give units.
Do not use two neighbouring experimental points unless they lie on the tangent. A large triangle reduces the percentage effect of reading uncertainty.
At the start, an initial tangent estimates initial rate before concentrations change substantially. Later gradients are usually smaller as reactants are consumed.
Check this topic from memory
Attempt the matching topic bank before reopening the notes. Use each missed idea to decide what to review next.
Particles must collide before many reactions can occur. Collision frequency is the number of collisions per unit time in the reacting system.
More collisions can increase opportunities for reaction, but not every collision produces products. Energy and suitable orientation determine whether a collision is effective.
Collision theory is a model connecting particle behaviour to observed rate, not a statement that one collision always completes a multi-step reaction.
6. Effective and non-effective collisions
An effective collision has enough energy to overcome the activation-energy barrier and an orientation suitable for the required bond changes. A non-effective collision fails one or both conditions.
The fraction of collisions with sufficient energy can change strongly with temperature. Orientation effects depend on molecular geometry and the reaction mechanism.
Do not define effective merely as “particles touch.” Contact is necessary but may not be sufficient.
7. Concentration and rate
Increasing concentration places more reacting particles in a given volume. Collision frequency rises, so effective collisions usually occur more frequently and rate increases.
At constant temperature, the energy distribution is not shifted simply by increasing concentration. The main AS explanation is more frequent collisions, not a larger fraction above activation energy.
The size of the rate change depends on mechanism and reaction orders studied later; at this boundary, the explanation is qualitative.
8. Gas pressure and rate
Increasing pressure by decreasing volume raises the concentration of gas particles. They collide more frequently, increasing effective-collision frequency and usually increasing rate.
Pressure changes matter directly for gaseous reactants. Compressing a vessel containing a liquid-phase reaction does not justify the same explanation without gas involvement.
Keep temperature constant when attributing the rate change to pressure, since heating changes the energy distribution as well.
9. Activation energy
Activation energy, EA, is the minimum energy required for a collision to be effective. It represents the energy barrier to the reaction pathway.
Activation energy is not the total energy of all reactant particles and not the enthalpy change. Exothermic reactions still need activation energy.
The reverse reaction has its own barrier from product level to the transition-state region.
10. Boltzmann distribution axes
A Boltzmann distribution plots number or fraction of particles on the vertical axis against kinetic energy on the horizontal axis. The curve begins at the origin, rises to a peak and approaches the energy axis asymptotically.
The area under the curve represents the total number of particles. At fixed particle number, changing temperature redistributes the same total area.
A vertical activation-energy line divides particles below the threshold from those with enough energy. The area beyond EA represents the relevant energetic fraction, not automatically the exact reacting fraction because orientation also matters.
11. Effect of higher temperature
At higher temperature, the distribution becomes broader, its peak becomes lower and shifts to higher energy. The total area remains the same for the same number of particles.
The area beyond EA increases substantially. Particles also move faster, so collision frequency rises. The much larger fraction of energetic collisions is usually the more important explanation for the strong rate increase.
Do not move the activation-energy line when only temperature changes. EA belongs to the pathway.
12. Effect of lower temperature
At lower temperature, the curve is taller and narrower with its peak at lower energy. The area beyond EA decreases, so fewer collisions are effective.
Collision frequency also falls because particles move more slowly. Together these changes reduce rate.
The total number of particles need not decrease; their energy distribution changes.
13. Catalysts and catalysis
A catalyst increases reaction rate without being chemically consumed overall. It participates in steps but is regenerated by the end of the catalytic cycle.
The catalyst provides a different reaction mechanism with lower activation energy. It does not add energy to particles and does not make the original barrier disappear.
A small catalyst amount can affect many reactant particles because it is regenerated, though poisoning or loss can reduce real performance.
14. Catalysts and Boltzmann distributions
At unchanged temperature, a catalyst does not alter the Boltzmann distribution. Instead, the lower catalysed EA line lies farther left, so a larger area of the existing distribution exceeds the threshold.
This increases the frequency of effective collisions or successful pathway events. Particle average kinetic energy remains unchanged.
Do not draw a new higher-temperature curve to represent a catalyst.
15. Catalysed pathway diagrams
Draw the same reactant and product energy levels with and without catalyst. The catalysed pathway has a lower maximum barrier and may have several steps with intermediate minima.
ΔH is unchanged because initial and final states are unchanged. Both forward and reverse activation energies are reduced through the alternative pathway.
Do not lower the product line or change an endothermic reaction to exothermic.
16. Homogeneous and heterogeneous catalysis
A homogeneous catalyst is in the same phase as the reactants and commonly forms reaction intermediates in solution or gas phase. A heterogeneous catalyst is in a different phase, often a solid surface with gaseous or liquid reactants.
For heterogeneous catalysis, reactants can adsorb at active sites, bonds weaken or orientation improves, reaction occurs and products desorb. These steps form an alternative mechanism.
Greater surface area can expose more active sites, but the catalyst's chemical identity and surface condition also matter.
17. Separate rate from equilibrium
A catalyst speeds forward and reverse directions. It reaches equilibrium sooner but does not change equilibrium composition or the equilibrium constant.
Temperature can change both rate and equilibrium position, so kinetic and equilibrium explanations must be kept separate. A faster reaction does not imply a larger equilibrium yield.
Graph interpretation should identify whether the question concerns initial slope, time to plateau or plateau height.
Worked application: compare average and instantaneous rate
A gas-forming reaction produces 18, 31, 40 and 46 cubic centimetres at 20, 40, 60 and 80 seconds. The average production rate from 20 to 60 seconds is 22 divided by 40, or 0.55 cubic centimetres per second. An instantaneous rate at 40 seconds must instead come from a tangent to the smooth volume-time curve at 40 seconds. It will not necessarily equal 0.55. If higher temperature produces a steeper initial tangent but the same final plateau, temperature increased rate without changing the limiting-reagent amount or final gas quantity in this non-equilibrium completion experiment.
Common misconceptions and corrections
Defining rate as time taken. Rate is change per time; endpoint rate may be reciprocal time.
Using a chord when instantaneous rate is required. Draw a tangent.
Using a tiny tangent triangle. Widely separated points improve reading precision.
Dropping units from a gradient. Derive them from axes.
Calling a higher plateau a faster initial rate. Plateau and slope describe different features.
Reporting a negative reactant gradient as negative reaction speed without context. State consumption or magnitude.
Saying every collision reacts. Energy and orientation matter.
Defining effective collision as contact only. It must meet energy and orientation requirements.
Saying concentration raises particle energy. It raises collision frequency at fixed temperature.
Applying gas-pressure reasoning to every reaction phase. It directly changes gas concentration.
Defining EA as reaction enthalpy. It is the minimum collision energy.
Saying exothermic reactions need no EA. They still have a barrier.
Starting a Boltzmann curve above the origin. It begins at zero.
Making the distribution end at a fixed maximum energy. It approaches the axis asymptotically.
Changing total area when only temperature changes. Particle number is fixed.
Moving EA right when temperature rises. The uncatalysed pathway is unchanged.
Saying only collision frequency explains the temperature effect. The energetic fraction changes strongly.
Drawing the hotter curve taller and narrower. It is lower and broader.
Saying a catalyst is never involved chemically. It participates and is regenerated.
Saying a catalyst supplies activation energy. It lowers the pathway requirement.
Changing the Boltzmann curve for a catalyst. Move the EA threshold left.
Changing ΔH on a catalysed pathway. Initial and final levels remain.
Saying only forward EA falls. The alternative pathway lowers both directional barriers.
Calling a solid catalyst in a gas reaction homogeneous. It is heterogeneous.
Saying a catalyst increases equilibrium yield. It changes time, not position.
Equating faster plateau arrival with a higher plateau. Rate and final amount differ.
Assessment guidance
Rate answers need the measured change, time interval, sign convention and units. Use a tangent and large triangle for instantaneous rate. Collision explanations should separate frequency from the fraction that meets activation energy and orientation requirements. Boltzmann sketches need labelled axes, unchanged total area, correct temperature peak shift and a fixed EA line. For catalysis, state different mechanism and lower EA, leave the distribution and ΔH unchanged, and distinguish homogeneous from heterogeneous phase relationships. Do not claim a rate factor changes equilibrium position unless a separate equilibrium principle supports it.
Retrieval practice
Calculate average and tangent rates from concentration, mass and gas-volume graphs. Explain concentration and gas-pressure effects using collision frequency. Draw low- and high-temperature Boltzmann distributions with a fixed EA and shade effective fractions. Add a catalysed EA to the same graph and compare pathway diagrams. Classify catalyst examples by phase, outline a surface mechanism and separate initial rate, time to equilibrium and equilibrium yield in mixed questions.