Cambridge International AS and A Level Chemistry 22: Analytical techniques
Cambridge International AS and A Level Chemistry 22: Analytical techniques
Study guide/
Cambridge International Chemistry 9701 notes on infrared functional-group analysis, mass spectra, isotope abundance, molecular ions, fragments and M+1 and M+2 deductions.
Analytical Techniques is Cambridge International Chemistry 9701 Topic 22. The AS boundary covers infrared functional-group analysis and mass-spectrum interpretation, including isotope abundances, molecular ions, simple fragments, carbon count from M+1 and chlorine or bromine from M+2. Instrument operation and the organic chemical tests from earlier topics are not part of this boundary.
1. Evidence roles of IR and mass spectra
Infrared spectroscopy identifies bonds and functional groups from absorption positions. Mass spectrometry supplies mass-to-charge values, isotope patterns, molecular mass and fragment evidence.
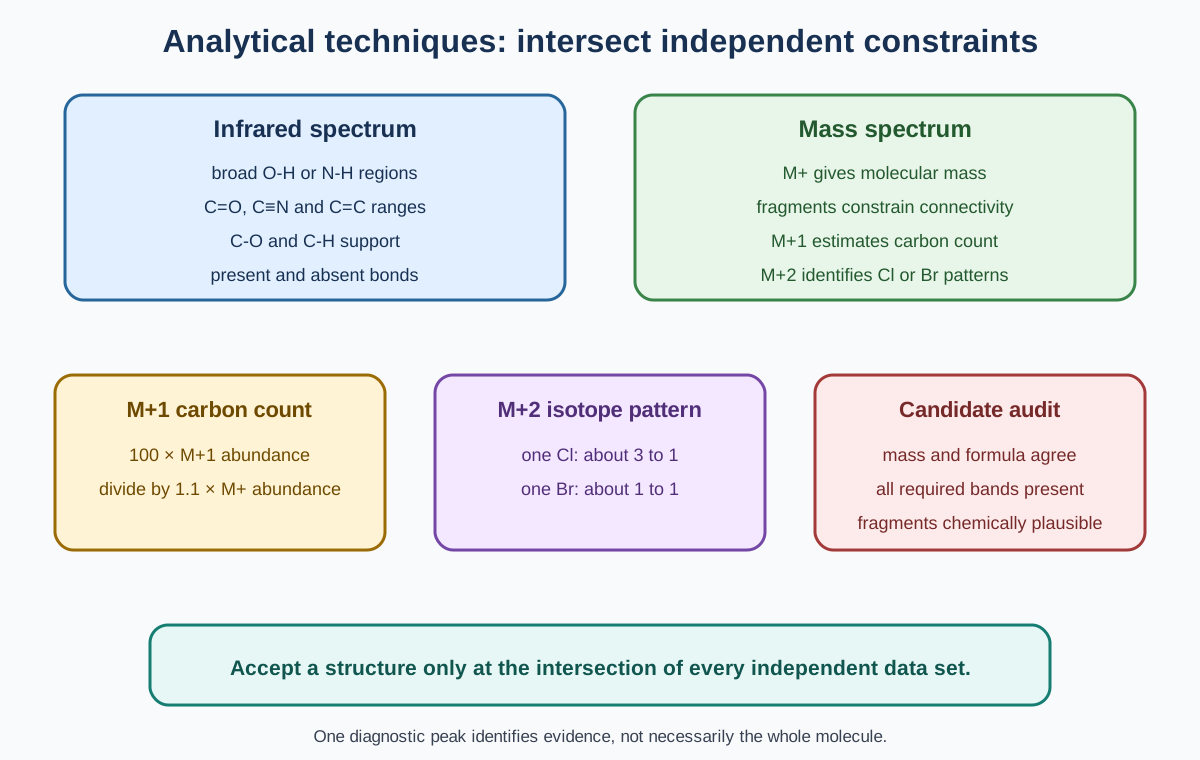
Neither technique normally gives a complete structure from one isolated peak. Combine positive evidence, significant absences, molecular formula constraints and plausible fragments.
Chemical tests can provide supporting evidence elsewhere in the syllabus, but Topic 22 itself assesses the two instrumental data types.
2. Reading an infrared spectrum
The horizontal axis is wavenumber in inverse centimetres. In the usual plotted convention, larger wavenumbers appear toward the left and smaller values toward the right.
Absorptions often point downward when percentage transmittance is plotted. Read position and broadness rather than treating peak height as a direct concentration measurement.
Use the official data ranges, because real absorptions vary within a band rather than appearing at one universal exact value.
3. Carbon-oxygen and carbon-carbon ranges
A carbon-oxygen single bond in hydroxy compounds and esters absorbs around 1040 to 1300 inverse centimetres.
A carbon-carbon double bond in alkenes and aromatic compounds lies around 1500 to 1680 inverse centimetres.
These ranges can overlap other fingerprint-region absorptions. A carbon-oxygen signal alone does not distinguish alcohol from ester; combine it with hydroxyl or carbonyl evidence.
4. Carbonyl ranges
Amide carbonyl absorbs around 1640 to 1690 inverse centimetres. Aldehyde, ketone and carboxylic-acid carbonyl groups lie broadly around 1670 to 1740. Ester carbonyl lies around 1710 to 1750.
These ranges overlap. A strong absorption near 1720 supports carbonyl but does not by itself identify its exact class.
Look for broad carboxylic-acid hydroxyl, hydroxy hydroxyl, carbon-oxygen or nitrogen-hydrogen evidence to refine the assignment.
5. Nitrile, carbon-hydrogen and nitrogen-hydrogen
The carbon-nitrogen triple bond in a nitrile absorbs around 2200 to 2250 inverse centimetres.
Alkane carbon-hydrogen bonds absorb around 2850 to 2950. Nitrogen-hydrogen bonds in amines and amides absorb around 3300 to 3500.
Check this topic from memory
Attempt the matching topic bank before reopening the notes. Use each missed idea to decide what to review next.
A signal in the nitrogen-hydrogen region supports such a bond but does not count every nitrogen atom or distinguish all amine classes without more data.
6. Two hydroxyl patterns
Carboxylic-acid hydroxyl produces a very broad absorption around 2500 to 3000 inverse centimetres. Hydroxy compounds such as alcohols produce a broad absorption around 3200 to 3600.
The acid band overlaps much of the carbon-hydrogen region and should be interpreted together with a carbonyl absorption.
An alcohol hydroxyl without a carbonyl suggests alcohol, while broad acid hydroxyl plus carbonyl strongly supports carboxylic acid.
7. Using absence as evidence
If a proposed alcohol lacks any broad 3200 to 3600 absorption, the proposal is weakened. If a proposed carbonyl compound lacks an absorption in the carbonyl region, reject it unless the spectrum quality or question supplies a reason.
Absence is most useful for strong, diagnostic bands. Crowded fingerprint-region absences are less decisive.
State which expected bond absorption is missing rather than saying only “the spectrum does not match”.
8. A structured IR workflow
Scan first for broad hydroxyl or nitrogen-hydrogen bands. Next inspect carbonyl and nitrile regions. Then check carbon-carbon double and carbon-oxygen evidence. Finally compare expected and absent bands for candidate structures.
Use ranges from the data sheet and avoid assigning every small fingerprint peak.
Conclude with the functional group supported, not a complete molecular identity unless other data justify it.
9. Mass-to-charge ratio
A mass spectrum plots relative abundance against mass-to-charge ratio, written m/e in the syllabus. Most simple ions considered carry one positive charge, so their m/e value equals their relative ionic mass.
If an ion had charge greater than one, m/e would not equal mass directly, but the AS interpretation normally uses singly charged molecular and fragment ions.
Do not label a neutral fragment as a spectrum peak; only charged species are detected.
10. Base peak and molecular ion
The base peak is the most abundant ion and is assigned relative abundance 100. It is not necessarily the molecular ion.
The molecular ion, M+, is formed by removing one electron without fragmenting the molecule. Its m/e gives molecular mass for a singly charged ion.
The molecular ion may be weak. It is often among the highest chemically meaningful m/e peaks, but small isotope peaks such as M+1 or M+2 lie above it.
11. Deducing molecular mass
Identify the molecular-ion cluster rather than simply choosing the tallest or highest plotted mark. Account for M+1 and M+2 isotope peaks.
If M+ appears at m/e 88, the organic molecule has relative molecular mass 88 under the standard singly charged interpretation.
Check whether the proposed formula has that mass and whether its isotope pattern matches the spectrum.
12. Simple fragmentation
The molecular ion can split into a positively charged fragment and neutral radical or molecule. Only the charged fragment appears.
Suggest fragment identity by matching m/e to a chemically plausible ion from bonds in the parent structure. For example, an alkyl fragment may result from carbon-carbon bond cleavage, while oxygen-containing molecules can give oxygen-stabilised ions.
Conserve atoms and charge. Several structural ions can share one nominal m/e, so use the parent structure and other peaks to choose plausibly.
13. Relative atomic mass from isotopes
Multiply each isotope mass by its relative abundance, add the products and divide by the total abundance.
If abundances are percentages, the denominator is 100. If they are peak intensities such as 3 and 1, divide by 4.
The answer should lie between the isotope masses and closer to the more abundant isotope. This range check catches swapped or unnormalised values.
14. M+1 and carbon count
Natural carbon-13 gives a small M+1 peak. Cambridge supplies the approximation:
number of carbon atoms = 100 times abundance of M+1, divided by 1.1 times abundance of M+.
Use the two abundances from the same spectrum scale. The result should be close to a whole number; round only after calculation and interpret unreasonable deviations cautiously.
The method assumes carbon-13 is the main relevant M+1 contributor in the simple compound.
15. Chlorine M+2 pattern
Chlorine-35 and chlorine-37 occur in an abundance ratio close to 3:1. A molecule containing one chlorine therefore shows M and M+2 peaks in an approximate 3:1 ratio.
The two-unit separation arises from substituting chlorine-37 for chlorine-35 in otherwise equivalent molecular ions.
More than one chlorine gives a binomial cluster rather than a single simple 3:1 pair, so inspect all relevant peaks.
16. Bromine M+2 pattern
Bromine-79 and bromine-81 have nearly equal abundance. A molecule containing one bromine gives M and M+2 peaks of roughly equal height.
This distinctive 1:1 pattern separates a simple brominated candidate from a one-chlorine candidate.
Again, multiple bromine atoms produce a wider isotope cluster whose ratios follow combinations of the isotopes.
17. Combining IR and mass evidence
First obtain molecular mass and isotope clues from the molecular-ion cluster. Use M+1 to estimate carbon count. Then apply IR bands and absences to constrain functional groups.
Test candidate formulae against molecular mass, carbon count, chlorine or bromine evidence and required bond absorptions. Use fragments to distinguish remaining structures.
A candidate must satisfy all independent constraints, not merely one memorable peak.
Worked application: identify a four-carbon acid
A spectrum has M+ at m/e 88 with relative abundance 80 and M+1 at 89 with abundance 3.52. The Cambridge approximation gives 100 times 3.52 divided by 1.1 times 80, which equals 4 carbon atoms. There is no strong M+2 isotope pair, so chlorine or bromine is not indicated. The IR spectrum contains a very broad absorption from about 2500 to 3000 inverse centimetres and a strong carbonyl absorption near 1710. Together these support a carboxylic acid. Molecular mass 88 and four carbons are consistent with butanoic acid or a branched isomer, so fragments or further evidence are needed to distinguish connectivity.
Common misconceptions and corrections
Reading the IR axis as increasing left to right. Typical wavenumber plots decrease rightward.
Treating downward transmittance bands as negative abundance. They are absorptions.
Using one exact wavenumber for every bond. Use data ranges.
Identifying ester from carbon-oxygen alone. Combine with carbonyl.
Identifying a specific carbonyl class from one 1720 band. Ranges overlap.
Calling acid hydroxyl a narrow 3400 band. It is very broad around 2500 to 3000.
Calling every broad hydroxyl band carboxylic acid. Acid also needs carbonyl evidence.
Assigning every fingerprint peak. Focus on diagnostic ranges.
Ignoring absence of an expected strong band. It can reject a candidate.
Calling the base peak the molecular ion automatically. It is only most abundant.
Choosing the highest peak as M+ without considering isotopes. M+1 and M+2 lie above M.
Treating M+ as a protonated molecule. It is an electron-loss radical cation here.
Using a neutral fragment as a detected peak. Only ions appear.
Giving every m/e one unique fragment identity. Isomers can share nominal mass.
Averaging isotope masses without abundance weighting. Weight and normalise.
Dividing percentage-weighted sum by isotope count. Divide by total abundance.
Reporting an atomic mass outside isotope bounds. Recheck arithmetic.
Using M+1 peak alone in the carbon formula. The M+ abundance is also required.
Rounding before calculating carbon count. Round only the final result.
Calling a 3:1 M to M+2 pair bromine. It indicates one chlorine.
Calling a 1:1 pair chlorine. It indicates one bromine.
Ignoring multiple-halogen cluster patterns. More atoms produce more peaks.
Using chemical tests as Topic 22's official boundary. The topic assesses IR and mass spectra.
Accepting a candidate from IR alone despite wrong molecular mass. Combine all constraints.
Claiming IR distinguishes all structural isomers. It mainly identifies bond environments.
Assessment guidance
Use the official IR ranges and name both the bond and compatible functional group, while checking for decisive missing absorptions. In mass spectra, distinguish base peak, molecular ion, isotope peaks and charged fragments. Weighted-isotope calculations must show abundance normalisation. Apply the supplied M+1 expression with matched peak scales and round only the final carbon count. Use approximate 3:1 M to M+2 for one chlorine and 1:1 for one bromine, but recognise wider clusters from multiple atoms. Final structural suggestions must satisfy molecular mass, carbon count, isotope pattern, IR evidence and plausible fragments together.
Retrieval practice
Memorise the official IR ranges by bond and functional-group context, then identify and reject candidates using both present and absent bands. Calculate relative atomic mass from percentage and ratio data. Locate molecular ions among isotope clusters, assign simple charged fragments and use M+1 to estimate carbon count. Practise chlorine and bromine M+2 patterns for one and multiple halogens, then solve combined IR and mass-spectrum problems without making a complete-structure claim before all constraints agree.