Cambridge International AS and A Level Chemistry 37: Analytical techniques
Cambridge International AS and A Level Chemistry 37: Analytical techniques
Study guide/
Cambridge International Chemistry 9701 notes on thin-layer and gas-liquid chromatography, carbon-13 and proton NMR, splitting, integration and proton exchange.
Analytical Techniques is Cambridge International Chemistry 9701 Topic 37. The A Level boundary covers thin-layer and gas-liquid chromatography, carbon-13 NMR and proton NMR, including integration, splitting, TMS, deuterated solvents and D2O exchange.
1. Thin-layer chromatography phases
In thin-layer chromatography, the stationary phase is a solid such as aluminium oxide on a support. The mobile phase is a solvent that rises through the plate.
The solvent may be polar or non-polar. Separation depends on each component's balance between attraction to the stationary phase and solubility in the mobile phase.
Do not call the plate itself the mobile phase or the solvent the stationary phase.
2. Baseline and solvent front
Place the sample spots on a pencil baseline above the initial solvent level. Pencil is used because graphite does not dissolve and travel like many inks.
Remove the plate before solvent reaches the top and mark the solvent front immediately. The solvent-front distance is needed for every Rf calculation.
A baseline submerged in solvent can wash samples directly into the reservoir and spoil separation.
3. Rf value
Rf equals distance travelled by the centre of a component spot divided by distance travelled by the solvent front, both measured from the baseline.
The value is dimensionless and normally lies between zero and one. Use distances from the same developed plate and the same origin.
An Rf is condition-dependent, so comparison requires the same stationary phase, mobile phase and temperature.
4. Interpreting TLC spots
One starting spot giving several separated spots indicates multiple detectable components. Matching Rf values under identical conditions supports, but does not prove, common identity.
Co-elution can place different substances at the same Rf. A second solvent system or independent test strengthens identification.
Spot intensity is not automatically a precise quantitative composition measure in ordinary TLC.
5. Explaining TLC movement
A component that interacts strongly with the stationary phase spends more time held back and tends to have lower Rf. A component more soluble in the mobile phase tends to travel farther and have higher Rf.
Both effects must be considered. Polarity alone does not determine movement without knowing the phases.
Changing solvent polarity can change every Rf and may reverse or improve separation patterns.
6. Gas-liquid chromatography phases
Gas-liquid chromatography uses a high-boiling non-polar liquid coated on a solid support as the stationary phase. The mobile phase is an unreactive carrier gas.
Check this topic from memory
Attempt the matching topic bank before reopening the notes. Use each missed idea to decide what to review next.
The sample vaporises and components partition between the carrier gas and stationary liquid while moving through the column.
The solid support holds the liquid film but is not the named separating liquid phase.
7. Retention time
Retention time is the time between injection and detection of a component peak. Stronger interaction with the stationary phase generally increases retention.
Volatility also influences how readily a component remains in the gas phase. Interpretation should follow the supplied stationary phase and conditions.
A retention time supports identity only when compared under the same instrumental conditions.
8. Gas chromatogram composition
Each resolved peak represents a detected component. The area under a peak, not simply its height, is proportional to amount when detector response assumptions are suitable.
Percentage composition is calculated as one peak area divided by total relevant peak area, multiplied by one hundred.
Overlapping peaks or unequal response factors can complicate real analyses, but examination data normally provides a valid basis for the requested calculation.
9. Carbon-13 NMR environments
Chemically equivalent carbon atoms give one carbon-13 NMR environment and therefore one signal in the simplified syllabus treatment.
Count environments by molecular symmetry and connectivity, not by total carbon atoms. Equivalent methyl groups may share a signal even though several carbons are present.
The number of signals is a structural constraint, not a complete structure by itself.
10. Carbon-13 chemical shift
Chemical shift indicates the electronic environment around a carbon. Nearby electronegative atoms, pi systems and carbonyl groups move signals into characteristic regions supplied in data.
Use ranges as evidence rather than exact fingerprints. A signal can narrow functional-group possibilities but must agree with formula and other spectra.
Symmetry can reduce the observed number of signals even when many carbons share a functional region.
11. Predicting carbon-13 peaks
Draw the structure with symmetry elements and label equivalent carbons using the same symbol. Count unique labels.
Test whether a proposed symmetry operation truly maps the whole molecule, including substituents, onto itself. Similar-looking positions are not equivalent when their paths through the structure differ.
Then predict plausible shift regions for each environment.
12. Proton NMR environments
Chemically equivalent protons produce one proton environment in the simplified analysis. Protons can be equivalent by symmetry or rapid rotation.
Count environments independently of proton number. A three-proton methyl group can give one signal, while two structurally different methyl groups give two.
Exchangeable O-H and N-H protons require special care because hydrogen bonding and exchange affect their appearance.
13. Proton chemical shifts
Protons near electronegative atoms, aromatic rings, double bonds or carbonyl groups occupy characteristic chemical-shift ranges. Use the official data supplied with the question.
Shift suggests local environment but may have overlapping ranges. Combine it with integration and splitting.
Do not identify a full molecule from one familiar shift alone.
14. Relative peak areas
Integrated peak area gives the relative number of protons contributing to each environment. Reduce areas to a simple whole-number ratio where appropriate.
The ratio must be consistent with molecular formula and structure. A ratio of three to two often suggests methyl and methylene groups but does not prove they are adjacent.
Exchangeable proton integrals can be unreliable in some contexts, so use given evidence carefully.
15. The n plus one rule
For the stated simple first-order cases, a proton group with n equivalent protons on an adjacent carbon is split into n plus one peaks.
No adjacent proton gives a singlet, one gives a doublet, two a triplet and three a quartet. More complex or non-equivalent neighbours may appear as a multiplet.
The rule counts neighbouring equivalent protons, not the protons producing the signal itself.
16. Reading paired splitting patterns
An ethyl fragment often gives a three-proton triplet for methyl next to two protons and a two-proton quartet for methylene next to three.
Integration, shift and mutual splitting together make this assignment persuasive. Either pattern alone can occur in other structures.
Check that each proposed neighbour predicts the other's splitting consistently.
17. Predicting a proton spectrum
Label unique proton environments, estimate their chemical-shift regions, assign relative integrations and count equivalent adjacent-carbon protons.
List signal, area and multiplicity together. Include O-H or N-H signals but do not routinely use them to split adjacent groups unless the question's simplified evidence explicitly supports it.
Audit total integrated protons against the formula.
18. Tetramethylsilane
Tetramethylsilane, TMS, is the reference standard assigned chemical shift zero. It gives one sharp signal because all twelve protons are equivalent.
It is chemically inert toward most samples, volatile and usually appears away from organic sample signals.
TMS provides a common reference rather than causing the sample's chemical shifts.
19. Deuterated solvents
Ordinary proton-containing solvent would produce a large proton NMR signal and obscure the sample. A deuterated solvent such as deuterated chloroform minimises this interference.
Deuterium is not observed at the same frequency in a proton NMR experiment. Small residual solvent signals may remain in real spectra.
The solvent must also dissolve the sample without reacting significantly.
20. D2O proton exchange
Adding D2O allows exchangeable O-H or N-H protons to exchange with deuterium. Their proton NMR signals disappear or diminish on rerunning the spectrum.
This identifies exchangeable proton environments. Carbon-bound hydrogens ordinarily remain.
Disappearance supports O-H or N-H presence but does not alone distinguish alcohol, phenol, acid or amine without other evidence.
21. Combined structure deduction
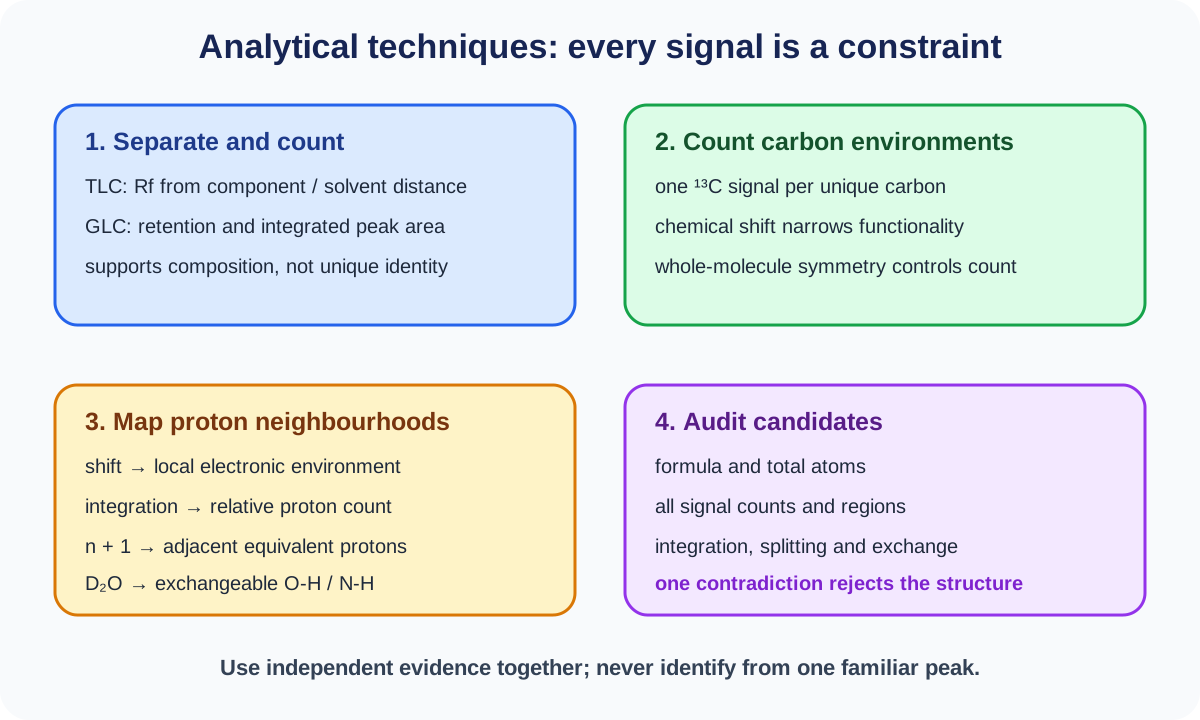
Begin with molecular formula or mass evidence to constrain carbon count and unsaturation. Use chromatography for mixture count or purity, carbon-13 NMR for unique carbon environments and proton NMR for local proton environments.
Every candidate must satisfy signal count, shifts, integration, splitting and exchange evidence simultaneously.
Reject a structure when one independent constraint fails, even if several familiar fragments match.
22. Handling symmetry
Symmetry can make distant atoms equivalent and reduce both carbon and proton signal counts. Substitution can break symmetry and split environments that were previously equivalent.
Draw the whole structure before declaring equivalence. Local fragments alone can hide different paths through the molecule.
Use predicted signal count as a strong discriminator between positional isomers.
23. Evidence strength and uncertainty
A matching chromatography value or chemical-shift range is supportive rather than unique. Integration and splitting add independent local constraints, while total formula and symmetry test the global structure.
State when more than one structure remains possible and identify the additional evidence needed. Do not overclaim certainty from an underdetermined spectrum.
The best deduction is the structure that satisfies all supplied evidence with no contradiction.
Worked application: combining chromatography and NMR constraints
A purified liquid gives one gas-chromatography peak. Its carbon-13 spectrum has three signals, including one in a carbonyl region. Proton NMR shows a three-proton triplet, a two-proton quartet and a one-proton broad signal that disappears after D2O. The triplet-quartet pair supports an ethyl group because the methyl neighbours two protons and the methylene neighbours three. D2O exchange identifies O-H or N-H, while the carbonyl carbon and three total carbon environments constrain the remaining group. Propanoic acid satisfies the ethyl fragment, acidic exchangeable proton and carbonyl evidence. The single chromatographic peak supports purity but does not itself prove identity. Ethyl methanoate has the same total carbon count but predicts different proton environments and no exchangeable O-H, so it is rejected.
Common misconceptions and corrections
Using ink for the TLC baseline. Soluble ink can travel.
Submerging the sample spots. Keep the baseline above solvent.
Forgetting to mark the solvent front. Rf then cannot be measured reliably.
Measuring Rf from the plate bottom. Measure both distances from baseline.
Giving Rf units. It is a ratio.
Comparing Rf across different solvents as identity proof. Conditions must match.
Treating one TLC spot as absolute purity proof. Components can co-elute.
Explaining movement by stationary attraction alone. Mobile-phase solubility also matters.
Calling the gas-chromatography support the stationary liquid. The liquid film is the phase.
Using reactive gas as mobile phase. The carrier is unreactive.
Equating retention time with boiling point only. Stationary interaction also matters.
Using peak height instead of area for composition. Integrate area.
Counting carbon atoms instead of carbon environments. Apply equivalence.
Assuming visually similar carbons are equivalent. Test whole-molecule symmetry.
Using carbon-13 peak count as a complete structure. It is one constraint.
Counting protons instead of proton environments. Equivalent protons share a signal.
Ignoring integration. Area gives relative proton number.
Treating a three-to-two ratio as proof of adjacency. Splitting must confirm it.
Applying n plus one to the signal's own protons. Count adjacent-carbon protons.
Calling a triplet three adjacent protons. It normally indicates two equivalent neighbours.
Using exchangeable O-H to split routinely. Exchange can remove simple coupling.
Forgetting the mutual ethyl pattern. Triplet and quartet should agree.
Calling TMS the solvent. It is the reference standard.
Saying deuterated solvent has no atoms. It replaces most relevant protons with deuterium.
Using D2O disappearance to prove an alcohol specifically. Acids, phenols and amines can also exchange.
Accepting a candidate that fails one spectrum. All evidence must agree.
Ignoring symmetry changes between positional isomers. Signal counts can distinguish them.
Claiming a single chromatography peak proves identity. It mainly supports one resolved component.
Assessment guidance
Chromatography answers should define both phases, baseline, solvent front, Rf or retention time and explain movement through stationary interaction plus mobile-phase solubility. Use peak area for gas-composition calculations. For NMR, label environments from full-structure symmetry, then combine chemical shift, carbon or proton signal count, integration, adjacent-carbon n-plus-one splitting and D2O exchange. State why TMS and deuterated solvent are used. In structure deduction, audit every independent datum and explicitly reject plausible alternatives that fail even one signal, integration, multiplicity or exchange constraint.
Retrieval practice
Calculate and interpret Rf values under controlled solvent conditions, explain reordered spots after a mobile-phase change and derive gas-mixture composition from peak areas. Predict carbon-13 signals for symmetric and substituted structures. For proton spectra, assign shift, integration and singlet-through-multiplet splitting, identify exchangeable protons with D2O and explain TMS and deuterated solvent. Finish with multi-evidence deductions that compare at least two candidate structures rather than pattern-matching one familiar fragment.