Cambridge International AS and A Level Chemistry Practical 6: Planning, Data Analysis and Evaluation
Cambridge International AS and A Level Chemistry Practical 6: Planning, Data Analysis and Evaluation
Study guide/
Cambridge International Chemistry 9701 Paper 5 notes on variables, predictions, methods, risk, tables, graphs, uncertainty, conclusions, anomalies and justified improvements.
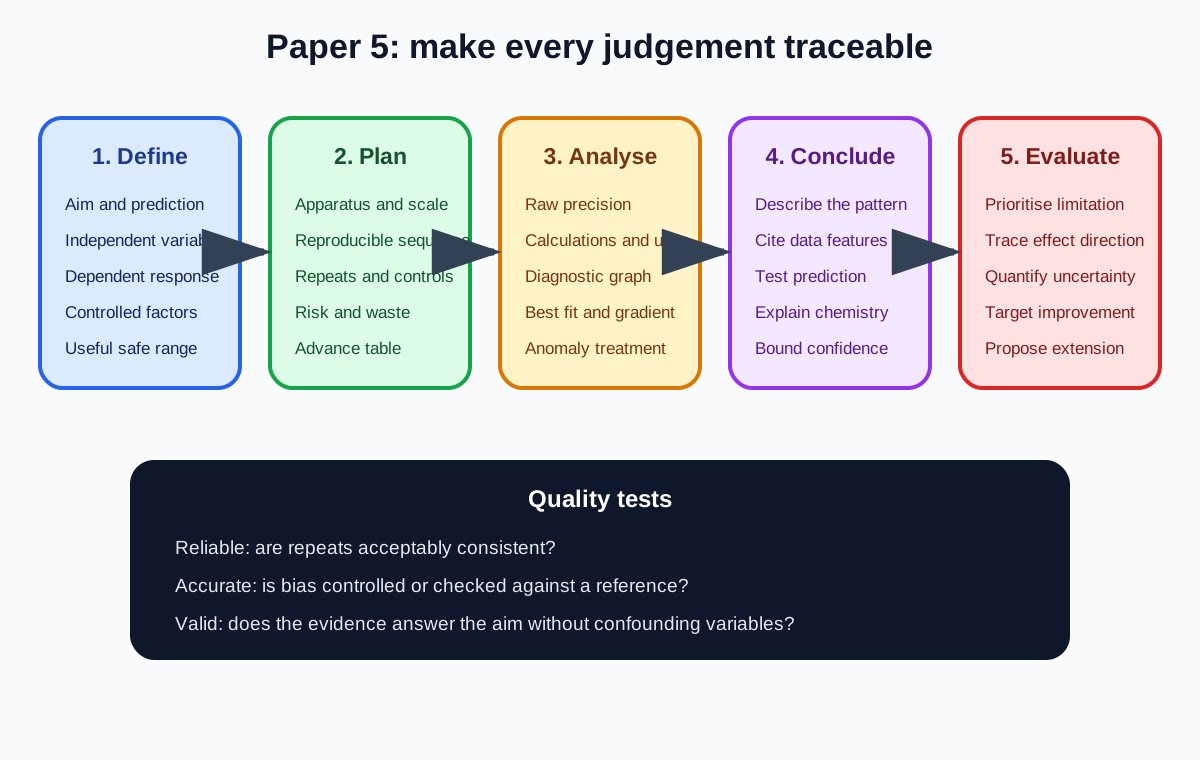
Planning, Data Analysis and Evaluation is the sixth Cambridge Chemistry 9701 practical-skills note. It follows the official Paper 5 boundary from defining a problem through a safe complete method, data processing, conclusion and evaluation. It also consolidates transferable Paper 3 standards for tables, graphs, precision and error. Subject theory supplies explanations, but this practical hub owns the evidence design and judgement.
1. Translate the question into an aim
State what factor is changed and what response is measured. A clear aim identifies the chemical system and the comparison or relationship being investigated.
Do not restate a broad topic such as investigate rate. Specify, for example, how concentration affects initial rate at constant temperature.
Use background information supplied in the question without assuming unprovided theory or equipment.
2. Identify the independent variable
The independent variable is deliberately changed. Define its numerical range, units and how each value is prepared.
Choose enough values to reveal a trend, not only two endpoints. Distribute values across the useful safe range and include more readings around an expected inflexion where relevant.
Changing several factors together prevents attribution of the result.
3. Identify the dependent variable
The dependent variable is measured in response. Define the raw measurement and any quantity calculated from it.
For a clock reaction, the raw value may be time to a fixed endpoint and the processed response reciprocal time. For calorimetry, raw temperatures produce a temperature change.
State the apparatus, resolution and exact endpoint.
4. Define control variables
Controls are factors that could affect the dependent response but are held constant. Name both the factor and how it is controlled.
Examples include total volume, temperature, reagent concentration not being investigated, surface area, mixing, electrode immersion and observation endpoint.
Writing keep conditions the same is not operationally useful.
5. Form a testable prediction
Express the expected relation between independent and dependent variables in words or as a predicted graph. Include direction and, where justified, mathematical form.
Link the prediction to relevant chemical reasoning without turning the answer into a theory essay.
An investigation tests whether data support the prediction over the measured range; it does not prove a universal law.
6. Choose a valid measurement strategy
Check this topic from memory
Attempt the matching topic bank before reopening the notes. Use each missed idea to decide what to review next.
Select a response that actually represents the aim. A fixed visual endpoint may compare relative rates, while continuous gas volume allows an initial gradient.
Ensure the expected change is large relative to measurement uncertainty. A balance reading to 0.01 grams is poorly matched to a predicted change of 0.01 grams.
Prefer direct, objective measurements when available, but acknowledge calibration and response limitations.
7. Select appropriate apparatus
Match capacity, graduations and chemical compatibility to each operation. Use volumetric apparatus for precise fixed volumes, measuring cylinders for less critical quantities and probes or thermometers over the necessary range.
Name apparatus sizes where this affects suitability. Avoid measuring a small volume in a vessel with a very large capacity.
Include stands, clamps, bungs, delivery tubing, insulation or stirring devices needed for a functioning arrangement.
8. Describe the complete apparatus arrangement
Use words and a labelled diagram where needed. Show connections, vessel contents, probe positions, gas-tight sections and safe outlets.
For gas collection, indicate how displacement or syringe movement measures volume. For heating, show the chosen heat source and support.
Do not rely on the examiner to infer missing connections.
9. Choose reagent quantities and concentrations
Provide workable values consistent with the intended range, apparatus and risk. Calculate dilutions so the total volume and other reactant amounts remain controlled.
Use an excess only when it has a stated purpose, such as ensuring another reagent is limiting. Excess must remain comparable across trials.
Avoid scales that generate unnecessary hazardous gas, pressure or heat.
10. Write a reproducible sequence
Order the steps from preparation through measurement and shutdown. State when timing starts, how mixing occurs, when readings are taken and when a run ends.
Include rinsing, equilibration, zeroing, leak checks and transfer technique where they affect results.
Another competent student should be able to obtain the intended data without guessing.
11. Build the results table in advance
Put the independent variable in the first column and raw dependent measurements before calculated quantities. Give each heading as quantity with unit.
Record repeated values in separate columns and a processed mean only after them. Keep raw readings at consistent precision compatible with the instrument.
Do not put units repeatedly in body cells or combine two different quantities under one heading.
12. Plan repeats and replication
Repeat enough values to assess scatter and identify anomalies. Replication is especially useful for subjective endpoints or naturally variable responses.
State how repeats are used, such as calculating a mean after investigating an anomalous value. Do not average blindly.
Repeats improve confidence in random variation but do not remove calibration error or a biased method.
13. Include control experiments when useful
A control removes or fixes the proposed causal factor while preserving other conditions. It tests whether another process could produce the observed response.
Examples include omitting catalyst, using a blank without analyte or holding concentration constant while repeating the apparatus procedure.
Explain what control outcome is expected and how it changes interpretation.
14. Complete the risk assessment
For each significant hazard, identify the substance or operation, the harm or exposure route and a targeted control. Examples include fume hood for hazardous gas, avoidance of naked flames for flammable material, face protection for hazardous particles and compatible gloves for irritants.
Include pressure, hot apparatus, broken glass and waste where relevant. Reduce scale when this preserves a measurable result.
Wear goggles alone is not a complete risk analysis.
15. Process raw data transparently
Show substitutions and intermediate stages for means, percentages, rates, concentrations, molar masses, gas quantities or other requested calculations.
Keep extra digits during working and round the final result appropriately. Calculated results should normally use the same or one more significant figure than the least precise supplied or measured input, following Cambridge guidance.
Check dimensions and units before interpreting the number.
16. Calculate measurement uncertainty
For the syllabus convention, maximum uncertainty in one analogue reading is half the interval between adjacent graduations. A quantity obtained from two readings includes both contributions.
Percentage uncertainty is absolute uncertainty divided by the measured change or result, multiplied by one hundred.
Use the actual apparatus and number of readings. Do not assign the same uncertainty to every instrument.
17. Select the graph variables
Plot the variable that tests the prediction. Sometimes this means a calculated transformation rather than the raw quantity.
Put the independent variable on the horizontal axis and the dependent or processed response on the vertical axis unless the required linear form dictates otherwise.
State how gradient, intercept, intersection or extrapolation answers the question.
18. Construct a readable graph
Label axes with quantity and unit, choose simple scales and use at least half the available grid in both directions. Plot points accurately with clear crosses or circled dots.
Draw a straight line or smooth curve of best fit that represents the trend. Do not join points sequentially unless the data type requires it.
Identify anomalous points rather than distorting the fit to pass through them.
19. Determine gradient and intercept
Choose two points on the best-fit line, not necessarily experimental points, separated by more than half the axis length where possible. Draw a large triangle and include units.
Read the intercept from the fit or calculate it using the line equation. Do not force a line through the origin unless theory or instructions justify it.
Use the gradient or intercept only after connecting it to the specified chemical quantity.
20. Treat anomalies responsibly
An anomaly deviates meaningfully from the trend or repeats. Recheck transcription, calculation, apparatus and procedure.
Repeat the condition if practical. Exclude a point from a mean or fit only with evidence and explanation, not because it is inconvenient.
One anomalous result does not automatically invalidate all other data.
21. Describe the data pattern
State direction, shape, proportional region, plateau, maximum, minimum or threshold using the actual range. Refer to representative values where useful.
Distinguish increases from is directly proportional. Direct proportionality needs the appropriate straight-line evidence through the origin within uncertainty.
Do not extrapolate a relationship beyond tested conditions without qualification.
22. Draw a supported conclusion
Answer the aim explicitly, cite the key data or graph feature and state whether the evidence supports the prediction.
Add a scientific explanation at the level of theory requested. Separate what the data show from why the pattern is chemically plausible.
Calibrate confidence to scatter, range, replication, anomalies and control quality.
23. Distinguish reliability, accuracy and validity
Reliable results show acceptable consistency under repeated conditions. Accurate results are close to an accepted or true value. Valid evidence addresses the stated question with controlled confounders.
A precise cluster can be inaccurate because of calibration bias. A wide range of readings can be reliable yet invalid if two variables change together.
Use these terms only with supporting evidence.
24. Classify random error
Random effects create scatter or unpredictable variation, such as judging a visual endpoint, timing a rapid event or fluctuating room temperature.
Repeats, means, automated sensing and tighter environmental control may reduce their impact.
State how the random effect changes individual readings rather than assigning one fixed direction.
25. Classify systematic error
Systematic effects bias results consistently, such as balance zero error, heat loss, a leaking gas system or a calibration offset.
Calibration, blank correction, improved insulation, leak testing or method redesign may address the source. Repetition alone does not.
Trace whether the final value becomes too high, too low or has a reduced magnitude.
26. Identify the most significant limitation
Prioritise by effect on the conclusion, not by listing every imperfection. Compare the size of measurement uncertainty with the measured range and consider whether the method omits part of the quantity.
Explain the causal chain from limitation to raw measurement, processed result and conclusion.
Avoid the unsupported label human error.
27. Propose a targeted improvement
Name the modification, explain how it reduces the identified mechanism and note any tradeoff. For example, a gas syringe may reduce dissolution loss relative to collection over water but must remain gas-tight and within capacity.
An improvement must be realistic for the scale and hazards. Use more accurate equipment is too vague.
Do not propose a change that alters the independent variable or creates a new dominant error.
28. Judge range and data density
An adequate range must expose the expected response without unsafe or unmeasurable extremes. Data density should be sufficient to distinguish line, curve, plateau or inflexion.
Add readings in regions where the trend changes rapidly, not merely at arbitrary evenly spaced values.
Explain how the additional data would change the confidence or calculated feature.
29. Extend the investigation
Propose a new question that changes one new independent factor while controlling the original system. State the new range, response and reason.
An extension is not simply another repeat. It tests transfer, mechanism or a boundary of the original conclusion.
Keep the extension safe and achievable with expected A Level apparatus.
30. Make the final judgement
Draw together trend, scatter, anomalies, uncertainty, replication, controls and systematic limitations. State how confidently the evidence answers the original aim.
Distinguish data that support a prediction from data that prove it. A qualified conclusion can be stronger scientifically than an absolute claim.
End with the highest-impact next action, not a generic list.
Worked application: concentration and reciprocal time
A clock experiment uses five final reactant concentrations while total volume and temperature are held constant. At 0.0400 moles per cubic decimetre, repeat endpoint times are 49.8, 50.4 and 50.1 seconds, giving a mean of 50.1 seconds and reciprocal time of 0.01996 per second. The three values are closely grouped, but that alone does not prove the concentration relation. Reciprocal time must be plotted against final concentration across all five conditions. A straight best-fit line through the origin within scatter would support direct proportionality over the tested range. A curved fit, significant intercept or drifting temperature would require a qualified conclusion and targeted evaluation.
Common misconceptions and corrections
Writing a topic instead of an aim. Name changed factor, measured response and system.
Changing two independent variables together. Hold possible confounders constant.
Using only two variable values. Choose a range with enough points to reveal shape.
Calling a calculated value the raw measurement. Record both stages.
Writing control temperature without a method. State how it is held or monitored.
Predicting without direction or graph form. Make the relationship testable.
Choosing a response too small for the apparatus. Match resolution to expected change.
Naming apparatus without capacity. Include size where suitability depends on it.
Leaving gas connections implicit. Show the complete arrangement.
Choosing unsafe reagent quantities. Balance measurable response and risk.
Omitting when timing starts. Define the trigger and endpoint.
Creating the results table after collecting data. Plan it in advance.
Putting units in every data cell. Put them in headings.
Recording repeats at inconsistent precision. Follow instrument resolution.
Averaging an anomaly without investigation. Check and justify treatment.
Saying repeats improve accuracy automatically. They mainly expose random variation.
Calling a repeat a control. A control removes or fixes a causal factor.
Writing only wear goggles for risk. Link hazard, exposure and control.
Rounding every intermediate calculation. Retain digits until the final result.
Using one-reading uncertainty for a difference. Include both readings.
Plotting variables without linking them to the prediction. Choose a diagnostic graph.
Using cramped awkward scales. Use simple scales and most of the grid.
Joining point to point. Draw a best-fit line or curve.
Taking gradient from adjacent data points. Use distant points on the fit.
Forcing the line through zero. Require theoretical or data support.
Deleting a point because it spoils the trend. Investigate it first.
Calling any increase directly proportional. Test the proper linear relation.
Extrapolating beyond the data without qualification. Bound the conclusion.
Saying the prediction is proven. State whether evidence supports it.
Using reliable, accurate and valid as synonyms. Judge each separately.
Giving random error a fixed high or low direction. It creates unpredictable scatter.
Proposing repeats for calibration bias. Correct or calibrate the systematic source.
Writing human error. Name the observable mechanism.
Listing many trivial limitations. Prioritise the most significant.
Writing use better equipment. Name the instrument and mechanism improved.
Calling another repeat an extension. Ask a genuinely new one-variable question.
Giving an absolute confidence claim. Integrate data quality and limitations.
Assessment guidance
Paper 5 answers should read as an executable investigation. Define independent, dependent and controlled variables, prediction, range, apparatus, quantities, sequence, repeats, results table, processing, graph and hazard-specific controls. Show why each design choice answers the aim. In analysis, preserve raw precision, show calculations, choose diagnostic axes, use proper best-fit and gradient methods and investigate anomalies. Conclusions must cite the measured pattern, address the prediction and remain bounded by range and data quality. Evaluation should classify the dominant limitation, trace its direction or scatter, quantify uncertainty where possible and propose a realistic mechanism-matched improvement or extension.
Retrieval practice
Take one rate, calorimetry, electrochemical and solubility question and write a full Paper 5 plan for each. For every plan, specify variables, five or more values, apparatus, quantities, sequence, risk, table and predicted graph. Then process a sample dataset with means, percentage uncertainty, best fit, gradient and anomaly handling. Finish by writing one evidence-based conclusion, one random limitation, one systematic limitation, one targeted improvement and one genuinely new extension.
Cambridge International, Chemistry 9701 syllabus for examinations in 2025, 2026 and 2027, Practical Assessment section for Paper 5 defining the problem, method, risk, data analysis, conclusion and evaluation, with Paper 3 presentation, graph, uncertainty and error expectations used where the skills overlap.