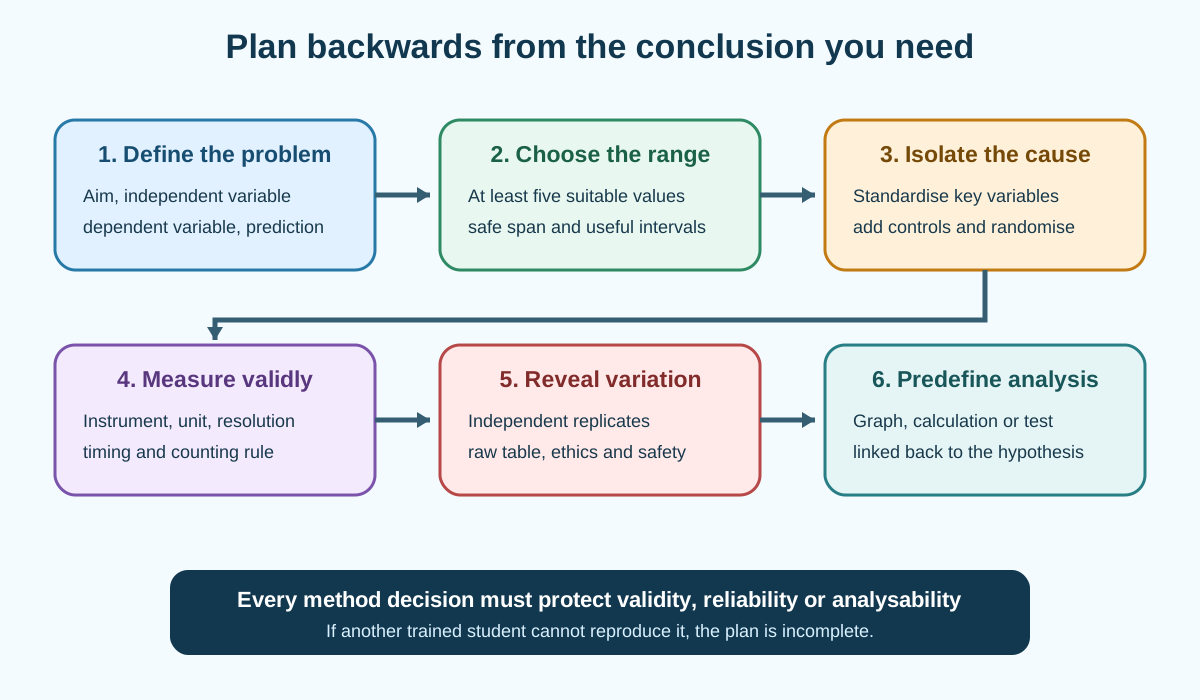
Planning Investigations and Variables develops the first official AO3 practical-skill aspect for Cambridge International AS and A Level Marine Science 9693. The syllabus assesses planning in Paper 2 and Paper 4, with more scaffolding at AS Level and a less scaffolded extended plan at A Level. A complete plan turns a question into a fair, safe, ethical and analysable test rather than a list of apparatus.
Official assessment boundary
Paper 2 applies AO3 to Topics 1 to 5 and may transfer skills from any AS core practical activity into an unfamiliar context. Paper 4 primarily applies AO3 to Topics 6 to 9, can require relevant AS knowledge and may draw on any core practical activity across Topics 1 to 9.
Both papers can assess problem definition, estimates, predictions, hypotheses, techniques, controls, replicates, data presentation, analysis, conclusions and evaluation. Paper 4 expects greater independence and can include A Level statistics.
This note owns planning decisions. The separate practical notes own apparatus and risk, raw records, graphs, uncertainty, statistics, evaluation and whole-paper strategy in greater depth.
From a question to a testable aim
A research question identifies a possible relationship, such as whether salinity affects mussel filtration rate. The aim states what will be changed and what will be measured:
To investigate the effect of salinity on the filtration rate of mussels.
This phrasing exposes the variables immediately. Avoid vague aims such as "to investigate mussels" because they do not define a measurable problem.
In observational fieldwork, the aim may examine association rather than direct cause, such as whether limpet abundance changes with distance up a rocky shore.
Independent and dependent variables
The independent variable is the factor deliberately changed or the naturally varying factor used to form groups or positions. The dependent variable is the measured response.
For an experiment on salinity and filtration rate:
independent variable: salinity of the water
dependent variable: filtration rate, measured through change in particle concentration per unit time
For a shore transect:
independent variable: distance from a fixed shore reference or height above chart datum
dependent variable: abundance or percentage cover of the named organism
Operational definitions matter. "Growth" could mean change in mass, length, area or cell number. Name the measurement and time interval.
Check this topic from memory
Attempt the matching topic bank before reopening the notes. Use each missed idea to decide what to review next.
A prediction states the expected pattern. A scientific hypothesis proposes a testable relationship and can include a mechanism.
For example:
As light intensity increases, photosynthetic oxygen production will increase until another factor becomes limiting because more light energy is available for photosynthesis.
A predicted graph can express direction, curve shape, plateau, optimum or threshold. It should match the variables and not add unsupported precision.
A hypothesis can be supported or not supported by evidence. A single investigation does not prove it permanently.
Null hypothesis
When a statistical test is planned, state an appropriate null hypothesis. For correlation:
There is no significant correlation between distance up the shore and limpet abundance.
For a comparison:
There is no significant difference between the mean shell-mass loss at the two pH conditions.
The conclusion must refer back to the same relationship or difference and use the statistical outcome. Do not write "there is no difference" when the test only says there is insufficient evidence of a statistically significant difference.
Variables to standardise
A standardised variable is kept sufficiently constant so it does not provide a competing explanation for change in the dependent variable.
Choose variables with a plausible material effect. In a shell dissolution investigation, these include shell species, exposed surface area, solution volume, duration, temperature and agitation. Variation among nominally identical test tubes is unlikely to need a separate control statement.
State how each important variable will be standardised. "Control temperature" is incomplete; "place all tubes in the same thermostatically controlled water bath at the stated temperature" is operational.
Some variables cannot be held exactly constant in fieldwork. Measure or restrict them, randomise placement, block the design or acknowledge their effect.
Experimental controls
A control treatment provides a comparison that omits the tested factor or represents a reference condition. It tests whether the independent variable, rather than another part of the procedure, causes the response.
Examples include:
a known reference pH when testing acidification
a chamber without the organism when measuring oxygen change
an unshaded treatment when testing shade
an identical setup without added nutrient when testing enrichment
A controlled variable and a control treatment are different. One is held constant; the other is a comparison group.
Negative and positive controls can test absence of effect or confirm that the measurement system can detect a known effect, where appropriate.
Choosing the independent-variable range
The official planning criteria require a suitable range and a minimum of five different independent-variable values. The range should be wide enough to reveal the expected pattern, safe for organisms and feasible with the apparatus.
Pilot work or supplied information can prevent values that all produce no response or immediate mortality. Include the biologically relevant range and, when useful, a reference condition.
Intervals can be equal when a general trend is expected. Smaller intervals near a suspected threshold or optimum may resolve the pattern better, provided the overall range remains adequate.
List actual values rather than saying "use several concentrations".
Changing the independent variable accurately
Describe how values will be prepared or located. Salinity may be set by measured dilution or salt addition, temperature by water baths, light by measured distance or filters, and shore position by a tape placed along a defined transect.
Verify the achieved value where possible. A labelled treatment is not evidence that pH, salinity or temperature remained at its target.
Avoid changing a second factor inadvertently. Moving a lamp changes light but may also change temperature, so use a heat shield, LED source or water bath and monitor temperature.
Measuring the dependent variable
Choose a method that is valid, sufficiently sensitive and repeatable. State the instrument, unit, measurement interval and calculation.
If the response is rate, collect a change over a known time and calculate change divided by time. If the response is abundance, define the sampling unit and counting rule. If it is colour, use a quantitative scale or sensor rather than an unexplained judgement.
The measurement resolution should detect differences expected across the chosen range.
Replicates and sample size
Replicates are independent measurements made at the same independent-variable value. They reveal random variation, allow a mean and help identify anomalous results.
Technical repeats of the same prepared sample mainly test measurement repeatability. Biological replicates from different organisms reveal biological variation. State which is used.
More replicates usually improve confidence but cost time and may use more organisms. Choose a feasible number and keep it the same across treatments unless a justified design requires otherwise.
Repeating one reading without resetting the experimental unit is not always independent replication.
Randomisation and order effects
Random assignment of organisms or samples reduces systematic allocation bias. Randomising treatment order reduces effects of time, warming, fatigue or instrument drift.
If conditions change predictably, use blocks. For example, test one replicate of every treatment in each time block rather than completing all replicates of one treatment first.
On a shore, random coordinates within defined zones can prevent the observer from choosing unusually dense patches.
Planning ecological sampling
Field investigations must define the target population, sampling frame, sampling unit and placement method. Use random sampling to estimate a representative mean within a reasonably uniform area. Use systematic sampling along a transect to investigate a gradient.
Quadrat size and number affect precision and feasibility. Small quadrats may miss patchy or rare organisms; very large quadrats reduce the number possible. Pilot sampling can guide a suitable design.
Define abundance as count, density, frequency or percentage cover and keep the rule consistent.
Avoid pseudoreplication. Many quadrats along one transect do not automatically represent multiple independent shores.
Ethics and organism welfare
Use the minimum number of organisms consistent with useful evidence. Reduce handling, exposure time and stress; maintain appropriate oxygen, temperature and salinity; and return organisms safely where lawful and ecologically appropriate.
Do not release non-native, captive or exposed organisms without a justified protocol. Empty shells or non-living models may replace live organisms for some questions.
Ethical treatment is an explicit official planning expectation, not an optional closing sentence.
Risk within the plan
Identify the hazard, who or what may be harmed, the route of harm and a specific precaution. Acids, glass, hot water, electricity near water, slippery shores, tides and living organisms require different controls.
Risk detail belongs primarily to Practical Skills 2, but every complete plan must show that its method is safe enough to perform.
Planning the results table
Construct the table before data collection. Include the independent variable first, raw replicate columns, calculated values and deductions if required. Put units in headings, not repeatedly in cells.
Instrument resolution determines recorded decimal places. A plan that says "record results" without defining table structure and precision is incomplete.
The raw-data plan must preserve enough information to check subsequent calculations.
Planning analysis and conclusion
State how the data will answer the aim. This may include calculating a mean and spread, plotting a line graph, comparing confidence intervals, or applying a justified correlation or difference test.
The graph type follows data type: line graph for continuous variables, bar chart for categories, and histogram for a frequency distribution.
Statistical choice follows the question and data, not personal preference. The analysis must lead back to the prediction or null hypothesis.
Writing a reproducible method
A plan must give enough detail for another trained student to perform the same investigation. A reliable order is:
identify and prepare experimental units
set and verify independent-variable values
standardise important variables and apply control treatments
measure the dependent variable with stated apparatus, unit and timing
reset or prevent carry-over between measurements
repeat independently at every value
record raw data in the planned table
analyse data and decide how the evidence tests the hypothesis
Quantities, times, distances and criteria should be explicit. Do not hide essential steps behind "repeat as usual".
Worked application: planning the shell pH investigation
Investigate pH effects on empty mollusc-shell mass loss. Prepare at least five verified pH values spanning the supplied marine range, with equal solution volumes in labelled vessels. Cut or select shell pieces from the same species with similar exposed area, rinse, dry to a consistent endpoint and record initial mass. Randomly assign independent pieces to treatments and use several biological-material replicates per pH. Incubate for the same time in one temperature-controlled water bath with equal agitation. Recheck pH, then rinse, dry and reweigh. Calculate mass and percentage mass loss, plot mean loss against pH and display spread. Standardise shell source, area, volume, duration and temperature. Empty-shell use reduces welfare concerns; eye protection and careful solution handling control risk.
Common misconceptions and corrections
Writing an aim with no measurable response. Name both variables operationally.
Calling the measured response the independent variable. It is the dependent variable.
Assuming a field gradient is deliberately manipulated. It may be an observational independent variable.
Writing a prediction with no direction. State the expected pattern.
Calling a supported hypothesis proven. Evidence supports it within limits.
Writing a null hypothesis with no named variables. State the exact relationship or difference.
Standardising every trivial feature. Prioritise variables likely to affect the response.
Saying only "control temperature". Explain how it will be held constant and checked.
Confusing a control treatment with a controlled variable. They have different roles.
Using three independent-variable values. The official planning expectation specifies at least five.
Choosing values outside safe biological limits. Use pilot or supplied evidence.
Using an overly narrow range. It may hide the pattern.
Changing lamp distance without controlling heat. A second variable changes.
Trusting a treatment label without verification. Measure achieved pH, salinity or temperature.
Measuring rate without a time interval. Rate requires change per time.
Calling repeated readings of one sample biological replicates. They do not capture between-organism variation.
Giving every treatment a different replicate count without reason. Comparability is weakened.
Testing all controls first and treatments later. Time drift may bias groups.
Choosing attractive field patches. Use random or systematic placement.
Treating many quadrats on one shore as many independent shores. That is pseudoreplication.
Changing abundance definition during sampling. Use one stated counting rule.
Ignoring organism welfare because the species is common. Ethical treatment still applies.
Listing "wear goggles" without a hazard. Link precaution to a specific risk.
Planning analysis only after seeing results. Predefine the evidence pathway.
Using a bar chart for a continuous salinity series. A line graph is usually appropriate.
Selecting a statistical test because it is familiar. Match it to the question and data.
Omitting raw replicates from the table. Means alone hide variation.
Writing "repeat" without saying what or how many times. Define independent replication.
Omitting quantities and timing. The method is not reproducible.
Concluding about causation from uncontrolled observational data. Alternative variables remain.
Assessment guidance
Start a planning answer by extracting the independent and dependent variables from the prompt. State a directional prediction or a precise null hypothesis when statistics are relevant. Give at least five justified independent-variable values, independent replicates, a valid measurement method, operational standardisation and an informative control. Include randomisation or a defensible field-sampling rule, ethical treatment and hazard-specific precautions. Predefine a table, graph or statistical analysis and explain how it answers the aim. Paper 4 plans need a continuous, reproducible method with less reliance on prompt scaffolding. Award-winning detail is selective: each decision should prevent bias, reveal variation or make the conclusion possible.
Retrieval practice
Take one laboratory and one shore-field question. For each, state the aim, variables, prediction, possible null hypothesis, five-value range, replicate type, control, standardisation, randomisation, ethical limit, raw table and analysis. Then identify one confounder and redesign the method to isolate the proposed relationship without changing its intended dependent variable.
Cambridge International, AS and A Level Marine Science 9693 syllabus for examinations in 2028, 2029 and 2030, Details of Assessment for Papers 2 and 4 and Practical work in Marine Science section 1, Experimental planning including making estimates, predictions and hypotheses, especially 1.1 Defining the problem and 1.2 Choosing appropriate techniques.