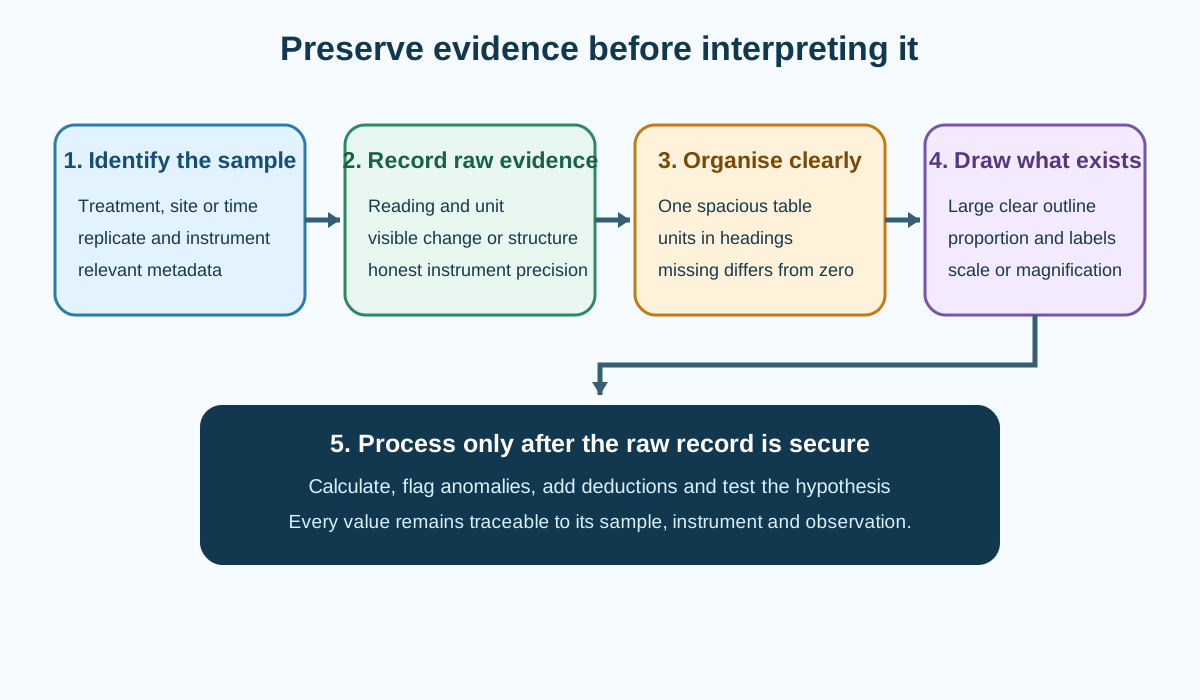
Recording Observations and Raw Data develops the official Cambridge International AS and A Level Marine Science 9693 AO3 requirement to present numerical data, values and observations in suitable forms. Paper 2 and Paper 4 can require a results table, biological drawing, labels or annotations. Paper 4 can also assess drawing magnification and scale lines. A scientific record preserves what was observed before interpretation changes it.
Official assessment boundary
The syllabus requires candidates to present results in a single table, use enough space, include raw, calculated and deduction columns when needed, place units in descriptive headings and match decimal places to the measuring instrument.
Biological drawings must be large, unshaded and made with fine, clear, unbroken outlines. Pencil is required, and ruler-drawn label lines have no arrowheads.
Paper 4 may require a drawing to a specified magnification, an appropriate scale line or calculation of image or drawing magnification. These requirements apply to unfamiliar marine structures as well as familiar examples.
Raw data, processed data and deductions
Raw data are direct readings or observations before calculation. Examples include each quadrat count, initial and final shell mass, oxygen concentration at every time, or a recorded colour change.
Processed data are derived from raw values, such as mass loss, mean abundance, rate, percentage change or diversity index. A deduction is an interpretation based on evidence, such as identifying an ion, structure or taxonomic group.
Keep these stages distinguishable. Recording only a mean destroys the replicate values needed to inspect spread or recalculate the result.
A correction should remain traceable. In handwritten work, cross out a wrong entry once and write the replacement clearly rather than erasing the history into ambiguity.
One coherent results table
The official preference is a single table of results when the data belong to one investigation. Put the independent variable or sample identifier in the first column, followed by raw replicates, processed values and deductions.
Use a title or surrounding sentence to identify the investigation. Column headings should describe the quantity, not merely "result" or "reading".
A logical shell investigation structure is:
pH
initial shell mass for each replicate
final shell mass for each replicate
calculated mass loss for each replicate
mean mass loss
Check this topic from memory
Attempt the matching topic bank before reopening the notes. Use each missed idea to decide what to review next.
Do not split related treatments into separate miniature tables unless the question structure requires it.
Units belong in headings
Write quantity and unit together in the column heading, using a clear separator such as mass / g or time / s. Units do not belong after every numerical entry in the table body.
The heading unit must match the recorded number. If distance is measured in centimetres but converted to metres, label the correct column separately.
Dimensionless quantities such as pH do not need an invented unit. Percentage has the symbol in its heading.
Keep the same unit down a column so comparisons and calculations are valid.
Decimal places and instrument resolution
Record raw readings to the precision supported by the instrument. A balance displaying 4.20 g should not be recorded as 4.2 g if the trailing zero conveys the 0.01 g resolution.
Readings from the same instrument should normally have consistent decimal places. An exact zero may need to appear as 0.00 when that is the instrument's displayed precision.
Calculated values follow significant-figure rules rather than automatically copying every calculator digit. Raw readings should not be rounded prematurely.
The uncertainty note owns detailed significant figures; the recording contract begins by preserving instrument precision honestly.
Replicates, missing values and anomalies
Give each replicate its own column or row according to the table design. Label replicates clearly and retain all original readings.
If a measurement cannot be obtained, use a defined symbol or note rather than entering zero. Zero is a measured value; missing is absence of a valid measurement.
Flag a suspected anomaly without silently deleting it. Its status should be justified through the pattern, method evidence or repeat result before exclusion from a calculation.
Never change a value merely because it does not match the prediction.
Sample identity and metadata
Records must connect each value to the correct treatment, time, site or organism. Label vessels and samples before measurement, using identifiers that match the table.
Relevant metadata can include site coordinates, transect position, depth, date, tide state, weather, observer or instrument identifier. Record only what is necessary to interpret or reproduce the investigation.
In fieldwork, time can matter because tide, light and temperature change. In microscopy, objective or scale calibration can matter.
Metadata should not replace controlled variables in the method; it documents conditions that may explain variation.
Quantitative observation language
Record measurements with a number and appropriate unit. For counts, define the counting rule. For percentage cover, state the grid or point method.
Use operational endpoints such as "the blue colour disappeared" or "the disc was no longer visible" rather than "the reaction finished" unless completion was independently established.
For time series, record at predetermined intervals, including the starting value where relevant.
If a value fluctuates, state whether the record is instantaneous, averaged over a time window or taken after stabilisation.
Qualitative observations
Qualitative evidence should be specific and comparative. Record colour, distribution, texture, shape, position, movement, precipitate, gas production or structural feature without inferring a cause prematurely.
"Cloudy white suspension formed" is an observation. "Protein was present" is a deduction that needs a validated test.
Use both starting and final states when change matters. "Green to yellow" is more informative than "changed colour".
Avoid subjective intensity words unless a defined scale or reference chart supports them.
Recording living-organism behaviour
Define the behaviour before observation. For example, movement can be number of grid lines crossed per minute, time spent in a zone or frequency of shell opening.
Use fixed observation periods and consistent start criteria. Blinding the observer to treatment can reduce expectation bias where practical.
Distinguish no observed movement from death. Welfare signs and recovery should be recorded separately.
Do not manipulate an animal solely to produce a dramatic observation.
Recording ecological samples
For quadrats, record every placement, including zero counts. Zeros are ecological evidence and prevent inflated abundance estimates.
For transects, record distance and corresponding abundance or abiotic factor in the same row. If several quadrats occur at one distance, preserve each replicate.
For percentage cover, state how overlapping species or boundary contacts are handled. For mark-release-recapture, keep marked, captured and recaptured counts distinct.
Photographs can support a record only if scale, orientation and sample identity are clear.
Biological drawing purpose
A biological drawing communicates observed structure accurately. It is not an artistic impression and should not contain imagined detail.
Use a sharp pencil and make the drawing large enough to show relevant relationships. Draw single, fine, continuous outlines. Do not sketch repeatedly, shade, colour or use stippling to simulate texture.
Include the number and arrangement of repeated parts accurately where feasible. Preserve relative proportions and orientation.
If the question requests selected structures, do not fill space with irrelevant surrounding material.
Low-power and high-power drawings
A low-power plan shows the arrangement and relative proportions of tissue regions or major structures without drawing individual cells throughout.
A high-power drawing shows a small representative group of cells or detailed structures. Cell boundaries and visible contents should be based on observation.
The chosen field must match the question. Higher magnification does not automatically earn more credit if it removes the required context.
State the specimen or view when ambiguity is possible.
Label lines and annotations
Draw label lines with a ruler. Lines should be straight, touch the correct structure, avoid crossing where possible and end without arrowheads. Put labels in a clear aligned area.
A label names a structure. An annotation adds an observed feature or relevant function, such as "thin wall provides a short diffusion distance" when the task requests functional annotation.
Do not let an annotation claim a feature that cannot be seen unless the question explicitly requires inference from known biology.
Spelling should be unambiguous, especially for paired or similar structures.
Magnification and actual size
Magnification is image size divided by actual size:
magnification=actual sizeimage size
Both sizes must use the same unit before division. Magnification has no unit.
Rearrange only after identifying known quantities. Measure the image along the same dimension used for actual size.
An image resized in a document has a different displayed magnification even though the specimen is unchanged.
Scale lines
A scale line represents a stated actual distance on the specimen. Draw a clear horizontal line of convenient length near the drawing and label it with the actual distance and unit.
Calculate its drawn length from the required magnification, or calculate the represented actual length from image size divided by magnification.
A scale line remains useful if the image is resized with it because both scale together. A written magnification becomes wrong after resizing.
Do not add decorative end ticks unless the required convention uses them clearly.
Drawing to a specified magnification
If the required magnification and actual specimen size are known, calculate the necessary drawing size before starting. Reserve enough page area and check the finished dimension.
The drawing must still preserve proportions. Enlarging one axis only does not meet a specified magnification.
Allow for line thickness and measurement uncertainty rather than claiming impossible exactness.
Use the ruler on the finished drawing, not on an imagined boundary.
Photographs, maps and image observations
When interpreting a photograph, distinguish visible evidence from scale-dependent inference. State location within the image and use the supplied scale or reference object.
For maps, record coordinates, distance, direction, boundary and legend categories accurately. A colour on a map is evidence only through its key.
Annotate important patterns without covering the evidence. Compare like-sized areas when estimating abundance or habitat cover.
Digital enhancement should not create features absent from the original data.
Data integrity and traceability
Record results at the time of observation, not from memory later. Keep sample identifiers consistent and preserve raw files or images where applicable.
Do not copy another group's measurement as if it were an independent replicate. Pooled class data should be identified and evaluated for method consistency.
Any exclusion, unit conversion or correction must be visible in the record. This allows another person to audit the evidence chain.
Good presentation is not cosmetic; it prevents treatment swaps, hidden variation and unreproducible calculations.
Worked application: recording a shore transect
At each of six distances up a rocky shore, place three quadrats using the stated systematic method. Use one table with distance / m first, then three limpet-count replicate columns, mean count, temperature / degrees Celsius and percentage cover of algae. Record every zero and use a note code for any inaccessible quadrat rather than entering zero. Keep whole-number counts, but record temperature to the thermometer's resolution and cover to the grid rule. Label site, date, tide phase and transect identity. Draw one unfamiliar limpet at large size with a single clear outline, accurate shell proportions and ruler-drawn labels without arrows. Add a scale line calculated from the supplied actual shell width, keeping all lengths in the same unit.
Common misconceptions and corrections
Recording only calculated means. Preserve raw replicates.
Making separate tables for every treatment. Use one coherent results table.
Writing units in every body cell. Put them in headings.
Using a heading called "results". Name the measured quantity.
Changing units halfway down a column. Use one consistent unit.
Dropping meaningful trailing zeros. They can show instrument resolution.
Adding calculator digits to raw readings. The instrument limits precision.
Entering zero for a missing reading. Zero is a measured result.
Deleting an anomalous value silently. Retain and justify treatment.
Changing a result to fit the hypothesis. Record evidence as observed.
Leaving samples unlabelled until the end. Identity can be lost.
Recording field counts without position. The gradient cannot be reconstructed.
Writing "reaction complete" from colour alone. Record the visible endpoint.
Calling a deduction an observation. Separate what was seen from what it means.
Using "darker" without a reference. Define a scale or comparison.
Equating no movement with death. They are not the same observation.
Omitting zero-count quadrats. This biases abundance upward.
Using a photograph without scale. Size cannot be inferred securely.
Drawing with repeated sketch lines. Use fine unbroken outlines.
Shading a biological drawing. The official convention requires unshaded structure.
Drawing structures not visible. Observation controls content.
Drawing every cell in a low-power plan. Show tissue arrangement instead.
Using arrowheads on label lines. Official label lines have no arrows.
Calling an annotation a label. An annotation adds information.
Dividing sizes in different units. Convert first.
Adding a unit to magnification. Magnification is a ratio.
Using width in the image and length for actual size. Match dimensions.
Writing magnification after resizing an image. It changes with display size.
Labelling a scale line only with magnification. Give actual distance and unit.
Stretching one drawing axis to reach a target size. Proportions and magnification fail.
Treating pooled class data as identical methods automatically. Check consistency.
Assessment guidance
Construct one spacious table before entering values. Put the independent variable or sample identifier first, preserve every raw replicate and add separate processed or deduction columns only when useful. Use descriptive headings with units and instrument-appropriate decimal places. Record precise visible changes without converting them prematurely into explanations. For biological drawings, prioritise size, proportion, fine unbroken outlines, no shading, pencil and ruler-drawn label lines without arrowheads. For magnification, convert units before using image size divided by actual size. For scale lines, label the represented actual length. Preserve anomalies and missing-value distinctions so later calculations remain auditable.
Retrieval practice
Design one results table each for a five-level laboratory experiment, a shore transect and qualitative identification tests. Mark raw, processed and deduction fields and assign units and decimal places. Then draw an unfamiliar marine structure at low and high power, add compliant labels and calculate magnification and a scale line after converting all dimensions to the same unit. Audit both records for traceability.