Cambridge International AS and A Level Marine Science Practical Skills 5: Uncertainty, precision and significant figures
Cambridge International AS and A Level Marine Science Practical Skills 5: Uncertainty, precision and significant figures
Study guide/
Cambridge Marine Science 9693 practical notes on resolution, precision, accuracy, random and systematic error, uncertainty, significant figures and confidence.
Uncertainty, Precision and Significant Figures develops the official Cambridge International AS and A Level Marine Science 9693 requirements to record at instrument-appropriate precision, identify random and systematic errors, judge replication and range, show calculations and report a justified number of significant figures. Uncertainty is information about evidential limits, not a confession that an investigation failed.
Official assessment boundary
Paper 2 and Paper 4 can allocate marks for appropriate units and significant figures. Raw quantitative data must match the measuring instrument's decimal places.
Candidates must distinguish systematic and random apparatus errors, identify anomalies, judge replication and range, and evaluate confidence in conclusions. The syllabus states that a fixed systematic error does not alter the trend in results, while random error may obscure a trend.
At A Level, standard deviation, standard error and confidence intervals extend uncertainty analysis. Their detailed calculation and statistical interpretation belong in Practical Skills 6.
Resolution
Resolution is the smallest change an instrument can display or distinguish. A balance reading to 0.01 g has finer resolution than one reading to 0.1 g.
Scale spacing does not always equal measurement uncertainty, but it sets a limit on what can be read directly. Analogue readings also depend on pointer width, parallax and interpolation.
Choose resolution that is small relative to the expected change. Measuring a 0.02 g shell loss with a 0.1 g balance cannot resolve the effect.
Digital digits beyond stable instrument response do not guarantee useful resolution.
Precision
Precision describes closeness among repeated measurements and can also refer to fineness of measurement. A tightly clustered set is precise even if all readings are shifted from the accepted value.
Random variation reduces repeatability and precision. More independent replicates describe that variation more reliably and improve the mean estimate.
Precision alone does not establish validity. A consistently wrong method can be highly precise.
Quote the observed spread or an appropriate statistic rather than calling results precise from appearance alone.
Accuracy
Accuracy is closeness to the accepted or true value. Calibration against known standards can reveal and reduce systematic bias.
In many biological field measurements, the true value is unknown. Accuracy is then evaluated through method validity, recovery tests, reference materials or comparison with a better method.
Check this topic from memory
Attempt the matching topic bank before reopening the notes. Use each missed idea to decide what to review next.
Increasing repeats does not remove a fixed zero error; the biased mean merely becomes more precisely estimated.
Use "more accurate method" only when explaining why its result should be closer to the intended value.
Repeatability, reproducibility and reliability
Repeatability is agreement when the same person uses the same method and equipment over a short period. Reproducibility tests agreement across operators, equipment, laboratories or times.
Reliability concerns consistency of evidence and strengthens with independent replication, clear procedure and controlled conditions.
Repeated readings of one sample test instrument or observer repeatability. Independent organisms or field units are needed to represent biological variation.
A large sample can be reliably biased if sampling is unrepresentative.
Random error
Random error changes unpredictably among readings. Sources include reaction-time variation, fluctuating probe values, small biological differences, turbulent flow and judgement of a visual endpoint.
Random error creates scatter and may affect the apparent trend. Repeats, means, improved endpoint definitions, automated measurement and better standardisation can reduce its influence.
It does not necessarily make each high reading balance one low reading in a small dataset.
The direction of one random error is usually unpredictable, so do not claim it always increases a result.
Systematic error
Systematic error shifts readings consistently because of calibration, method or design. Examples include a balance with a fixed positive zero offset, a stretched transect tape or a probe calibrated incorrectly.
A fixed offset can shift every value without changing the trend, matching the official syllabus distinction. It changes absolute values and may affect comparison with an accepted threshold.
If bias changes across the measurement range, the slope or trend can also be distorted. Identify the actual mechanism rather than using "systematic" as a guarantee of a parallel shift.
Calibration, blanks, corrected zero and method redesign target systematic error; repeats alone do not.
Anomalous results
An anomaly is a value inconsistent with the main pattern or its replicates. First check transcription, unit conversion, plotting and calculation.
Method evidence may explain it, such as a leaking vessel, damaged organism or probe disturbance. Repeat the treatment where feasible.
Retain the raw value and state whether it is excluded from a mean. Exclusion needs evidence, not simply disagreement with the hypothesis.
In naturally variable ecology, an extreme value may be genuine and can reveal patchiness.
Absolute uncertainty
Absolute uncertainty uses the same unit as the measurement. For a direct reading, an exam question may specify the uncertainty or expect a value based on scale and method.
When a quantity is found from two readings, such as final minus initial mass, uncertainty arises from both readings. A conservative approach adds their absolute uncertainties when the question's convention requires it.
State the adopted convention. Do not invent an uncertainty formula when the paper supplies one or asks only for qualitative evaluation.
Report measurement and uncertainty to compatible decimal places.
Percentage uncertainty
Percentage uncertainty compares absolute uncertainty with measured magnitude:
The same instrument uncertainty is proportionally larger for a smaller measured value. This is why measuring a tiny mass change by subtracting two large masses can be weak.
Increase the measured change, use finer-resolution apparatus or use a more direct method where valid.
Do not confuse percentage uncertainty with percentage change in the biological variable.
Uncertainty in repeated data
Range gives the highest minus lowest reading and is sensitive to sample size and extremes. It is available at AS and A Level.
At A Level, standard deviation describes spread among observations and standard error describes uncertainty in the mean. A confidence interval gives a range for the population mean estimate under its assumptions.
These do not correct bias or poor sampling. Small spread around a biased value remains inaccurate.
Compare uncertainty measures only when they refer to the same statistic and units.
Instrument uncertainty versus biological variation
Instrument uncertainty comes from resolution, calibration and reading method. Biological variation comes from real differences among organisms, sites or times.
If replicate spread is much larger than instrument resolution, a finer instrument alone may not reduce total variability substantially. More representative independent sampling may matter more.
If observed treatment differences are smaller than instrument resolution, apparatus is a dominant limitation.
Name the relevant source before proposing an improvement.
The official mathematical requirement states that an appropriate calculated answer normally has the same number of significant figures as, or one more than, the input datum with the fewest significant figures.
Keep guard digits during intermediate steps and round only the final answer. Premature rounding can change a mean, gradient or index.
Leading zeros are not significant; zeros between non-zero digits are; trailing zeros after a decimal can be significant.
Decimal places versus significant figures
Decimal places count digits after the decimal point. Significant figures count meaningful digits from the first non-zero digit.
The values 2.30 and 0.0230 both have three significant figures but different decimal places. A table of balance readings may require consistent decimal places; a calculated rate may be reported by significant figures.
Do not make every column share decimal places when quantities use different instruments or units.
Scientific notation makes significant figures explicit for very large or small values.
Units and prefixes
The syllabus requires appropriate units and prefixes from giga to nano. Convert units before combining values.
An uncertainty changes unit with the measurement. A percentage uncertainty remains dimensionless.
For gradients, divide y-axis unit by x-axis unit. For rates, include the relevant per-time unit.
Unit conversion can change decimal places without changing physical precision, so preserve the underlying significant figures.
Estimation and reasonableness
Estimate order of magnitude before accepting a calculator result. Check sign, unit and plausible biological range.
A dissolved-oxygen result hundreds of times the expected scale may signal a prefix or volume conversion error. A negative count or percentage cover above 100 per cent requires explanation or correction.
Reverse calculations can test whether a reported transformed value returns the original data.
Reasonableness checks find mistakes but do not authorise changing valid unexpected evidence.
Error direction
For each limitation, explain whether it raises, lowers or unpredictably changes the dependent value. Direction depends on the method.
If a wet shell retains water after treatment, final mass is too high and calculated mass loss is too low. If a pH probe drifts upward, treatment classification and trend may shift according to when readings occur.
Avoid unsupported statements that every limitation makes values "inaccurate" without a mechanism.
Direction strengthens evaluation and identifies the correct improvement.
Comparing a change with uncertainty
A treatment difference smaller than the measurement resolution cannot be distinguished securely. A difference larger than direct-reading uncertainty may still be uncertain if biological spread is large.
Use replicate spread or A Level error bars where available. Consider sample independence and bias before declaring significance.
Statistical significance is not the same as biological importance. A small reliable change may have little ecological effect, while a large uncertain change may require more evidence.
Never use a single uncertainty number as proof that all alternative explanations are excluded.
Improving measurement quality
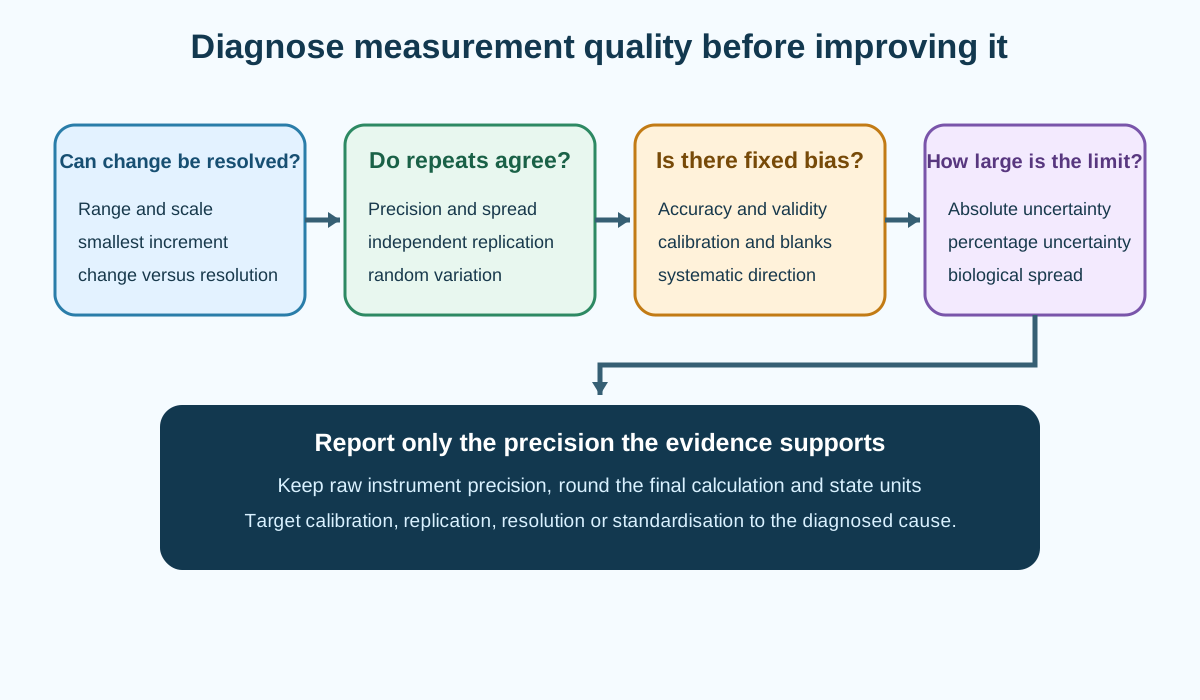
Match the improvement to the dominant limitation:
calibrate or zero to address systematic bias
use finer valid resolution for a small direct change
automate or clarify the endpoint to reduce random timing judgement
increase independent replicates to estimate biological variation better
standardise a changing confounder
expand the independent-variable range or use smaller intervals where pattern resolution is weak
Naming a more expensive instrument is insufficient without explaining how it changes evidence quality.
Worked application: uncertainty in shell mass loss
A shell is 4.26 g before exposure and 4.18 g after exposure on a balance reading to 0.01 g, giving a mass loss of 0.08 g. If the stated reading uncertainty is 0.01 g per mass, a conservative subtraction uncertainty is 0.02 g, or 25 per cent of the measured loss. The apparent change is therefore large relative to its uncertainty. Use several independent shell pieces, identical drying and longer exposure if biologically suitable. A finer calibrated balance addresses measurement resolution, while repeats reveal shell-to-shell variation. Residual water would make final mass too high and mass loss too low, so standardised rinsing and drying target a directional systematic method error. Keep unrounded values until final reporting and state the adopted uncertainty convention.
Common misconceptions and corrections
Calling resolution the same as accuracy. One is detectable increment; the other is closeness to truth.
Calling clustered readings automatically accurate. They may share bias.
Calling scattered readings accurate because their mean looks plausible. Precision and bias need evaluation.
Assuming digital means accurate. Calibration and method still matter.
Repeating one sample to represent biological variation. Independent units are needed.
Calling a large sample automatically representative. Sampling bias can remain.
Saying random error always increases values. Its direction is unpredictable.
Saying repeats remove all random error. They reduce its influence and estimate spread.
Saying repeats remove a fixed zero error. They do not correct systematic bias.
Calling every systematic error trend-changing. A fixed offset can preserve trend.
Assuming every systematic error preserves slope. Range-dependent bias may alter it.
Deleting an anomaly because it looks wrong. Check and justify.
Treating an extreme ecological count as apparatus failure. It may reflect patchiness.
Using an uncertainty with no unit. Absolute uncertainty shares the measurement unit.
Calling percentage uncertainty percentage change. They answer different questions.
Ignoring both readings in a difference. Each can contribute uncertainty.
Applying an unstated uncertainty convention. Use the supplied or declared rule.
Comparing range and standard error as identical spread measures. They describe different things.
Calling standard error biological spread. It describes precision of the mean.
Saying a confidence interval corrects bias. It does not.
Buying a finer instrument when biological variation dominates. Improve sampling instead.
Rounding every intermediate calculation. This accumulates error.
Reporting all calculator digits. Significant figures must be justified.
Calling leading zeros significant. They locate the decimal point.
Dropping a measured trailing zero. It can convey precision.
Confusing decimal places with significant figures. Their counting starts differently.
Combining centimetres and metres without conversion. Units must match.
Giving a gradient without compound units. Divide y unit by x unit.
Changing a surprising value after a reasonableness check. Investigate rather than fabricate.
Saying a limitation only makes results inaccurate. Explain mechanism and direction.
Calling statistical significance biological importance. Effect size and context matter.
Naming better apparatus without its benefit. Link it to the dominant uncertainty.
Assessment guidance
Use the prompt's instrument and method to separate resolution, precision, accuracy, random variation and systematic bias. State whether an error changes scatter, absolute values, the trend or all three, and explain its direction where possible. Preserve raw decimal places, keep guard digits and report final calculations at the same or one more significant figures than the least precise input, following the official convention. When uncertainty is required, state the rule, unit and percentage comparison. Judge whether treatment differences exceed measurement limits and biological spread. Every improvement should target the identified cause: calibration for bias, replication for random variation, finer valid resolution for small changes or better standardisation for confounding.
Retrieval practice
Classify twelve marine measurement problems by resolution, random error, systematic error or biological variation. For each, state direction, effect on trend and targeted improvement. Then calculate absolute and percentage uncertainty for a difference measurement, preserve significant figures through a multi-step rate calculation and compare two treatment means using direct-reading limits and replicate spread without claiming unsupported significance.