Cambridge International AS and A Level Marine Science Practical Skills 8: Paper 2 and Paper 4 investigation strategy
Cambridge International AS and A Level Marine Science Practical Skills 8: Paper 2 and Paper 4 investigation strategy
Study guide/
Cambridge Marine Science 9693 practical notes on Paper 2 and Paper 4 scope, practical transfer, planning, data handling, drawing, statistics and verification.
Paper 2 and Paper 4 Investigation Strategy integrates the complete Cambridge International AS and A Level Marine Science 9693 data-handling and investigative-skills boundary. Both are written papers of 1 hour 45 minutes and 75 marks, and both combine AO1 knowledge, AO2 application and AO3 experimental skills. Paper 2 provides more structured AS demand; Paper 4 expects less scaffolded A Level planning, analysis and evaluation.
Official paper comparison
Paper 2 primarily uses Topics 1 to 5. It can assess the Scientific Method, planning, evaluation, tables, graphs, biological drawings, calculations and data interpretation. Questions are short and structured, and planning may be scaffolded.
Paper 4 primarily uses Topics 6 to 9 but can require relevant Topics 1 to 5 knowledge. It includes short and extended responses, with much less scaffolding. An experimental plan can require continuous extended writing with little or no step-by-step support, although assessed aspects are stated.
Both papers can use passages, photographs, maps, apparatus diagrams, graphs, tables, methods or investigation results. Both require appropriate units and significant figures.
Assessment ownership
AO1 knowledge is used in context rather than recalled in isolation. It can explain a pattern, justify a control or transfer a known practical method.
AO2 handles information: calculating, graph reading, identifying patterns, interpreting unfamiliar data and drawing conclusions.
AO3 owns experimental planning, techniques, observation and data presentation, procedure evaluation and evidence quality.
One response can cross objectives. A graph description is AO2, its biological mechanism uses AO1, and criticism of the method uses AO3.
Paper 2 practical-activity set
Paper 2 can recall and transfer any core practical activity from Topics 1 to 5:
investigate salinity and water freezing point
use litmus, Universal Indicator and pH probes with water samples
investigate light intensity and photosynthesis rate
observe and draw unfamiliar specimens from required marine groups
investigate littoral distribution and abundance with quadrats, transects and mark-release-recapture
investigate substrate particle size and permeability
Recall the variable logic, observation, apparatus and limitations, not a memorised script only.
Paper 4 additional practical-activity set
Paper 4 can use every Topic 1 to 9 activity, including these A Level additions:
Check this topic from memory
Attempt the matching topic bank before reopening the notes. Use each missed idea to decide what to review next.
observe, draw and calculate magnification from unfamiliar specimens or cells
investigate diffusion and osmosis with plant tissue and non-living materials
investigate surface area to volume ratio and diffusion with agar blocks
immerse plant tissue in different water potentials to estimate tissue water potential
separate and identify chloroplast pigments by chromatography and Rf values
investigate wavelength and photosynthesis rate
investigate pH and mass loss of empty mollusc shells
These activities supply transferable method knowledge. An unfamiliar context may change organism, apparatus or measured response while retaining the same investigation principle.
Build a practical-transfer map
For each official activity, know:
independent and dependent variables
important standardised variables and control
apparatus principle and safety
raw table and expected graph
theory explaining the pattern
likely errors and matched improvements
Transfer by matching the measurement problem. A shell-loss investigation and agar-diffusion investigation both require initial and final measurements, controlled exposure and a calculated change, but their mechanisms and hazards differ.
Do not transplant irrelevant procedural details simply because a context sounds similar.
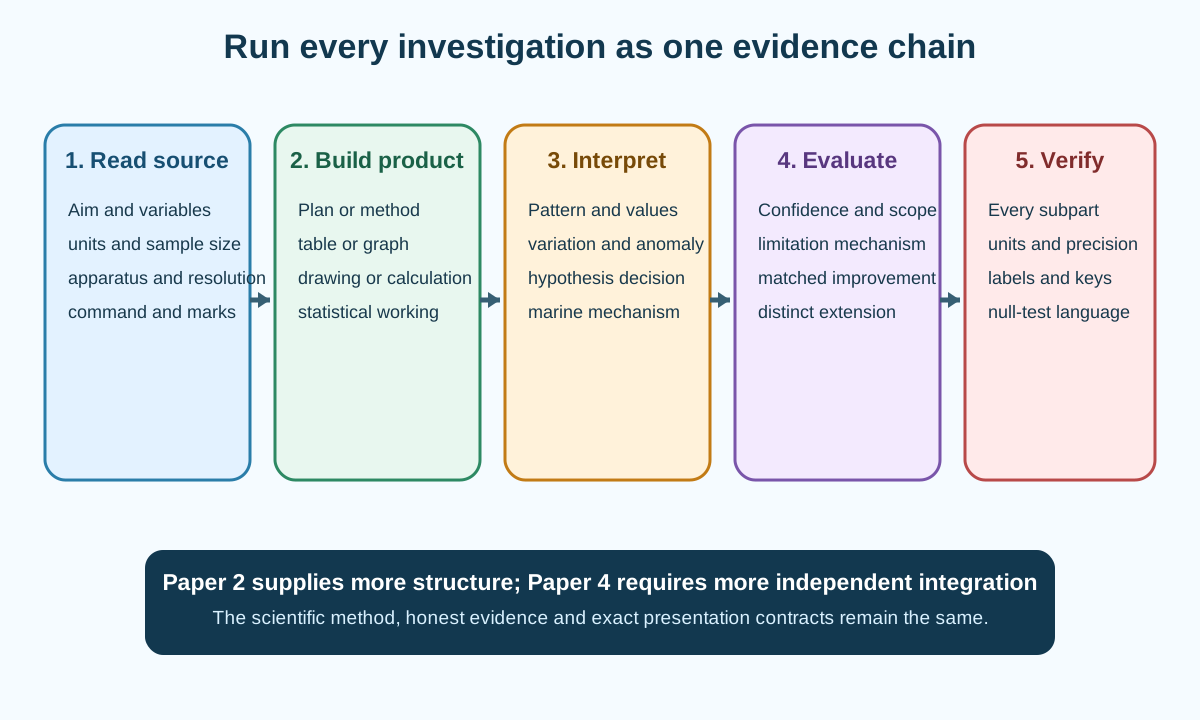
Read the source before answering
Underline or note the stated aim, variables, units, sample size, control, apparatus resolution and treatment range. Mark whether data are raw, mean, percentage, frequency or transformed.
Read graph keys, map legends, image scales and footnotes. A supplied definition or apparatus note may set the expected method.
Identify exactly what the command word asks. "Describe" gives the pattern; "explain" supplies a mechanism; "evaluate" judges quality using evidence; "justify" supports a choice.
Do not begin calculations before confirming the correct row, column and unit.
Use mark allocation as a scope signal
One-mark items usually need one precise point, value or calculation outcome. Higher-mark items need distinct linked elements rather than repeated wording.
For a four-mark method response, apparatus, operation, control and measurement detail may all matter. For an extended plan, cover the full evidence chain.
Do not spend disproportionate time decorating a low-mark drawing or rewriting the question. Preserve time for graph plotting, extended planning and final unit checks.
Mark allocation guides breadth but does not replace the command word.
Planning response workflow
Write a Paper 4 plan in a reproducible order:
state aim, prediction and variables
give at least five suitable independent-variable values
prepare or locate values accurately
standardise key variables and define controls
measure the dependent variable with apparatus, unit and timing
use independent replicates and randomisation where relevant
include ethical treatment, hazard and precaution
design the raw table and analysis
Paper 2 may ask these as separate prompts. Use the same internal framework even when only one component is requested.
Table task workflow
Reserve sufficient space. Put the independent variable or sample identifier first and include all raw replicates, calculated values and deductions needed.
Copy units into descriptive headings, not body cells. Use consistent decimal places for the same instrument.
Keep missing values distinct from zero and retain anomalies.
Before moving on, check that every supplied or observed value has a place and each column can support the later calculation.
Graph task workflow
Classify continuous, categorical, frequency or paired-association data. Choose line graph, bar chart, histogram or scatter display accordingly.
Label axes with quantity and unit, use most of the grid with simple scales and plot small accurate symbols. Add keys and identified error bars where required.
Choose ruled joins, smooth curve or best fit from the scientific meaning. Do not extrapolate without evidence.
Recheck coordinates against the table before interpreting the graph.
Biological drawing workflow
Read whether the task requests a plan drawing, selected cells, labels, annotations, specified magnification or scale line.
Use a large pencil drawing with clear single outlines, correct proportion and no shading. Use ruler-drawn label lines without arrowheads.
For magnification, convert image and actual size to the same unit. For a scale line, label the actual represented distance and unit.
Do not add structures that are not visible in the specimen or image.
Calculation workflow
Write the formula or relationship, substitute values with units, show key steps, retain guard digits and round only the final answer.
Estimate scale and sign first. Check prefixes, powers, ratios and whether percentage change uses the correct starting denominator.
For a graph gradient, use two widely separated points on the line or tangent. For calibration, stay within range unless extrapolation is justified.
The official convention generally reports the same or one more significant figures than the least precise input.
Statistics workflow
At AS and A Level, select among mean, median, mode, range, Lincoln, Simpson and Spearman. At A Level, add SD, SE, confidence intervals and chi-squared.
State the null hypothesis for a significance test. Check independence, paired or categorical structure and sampling assumptions before calculation.
Use supplied formulae and critical-value tables carefully. Paper 4 requires recall that one-dimensional chi-squared degrees of freedom equal number of classes minus one.
Finish with a decision and contextual interpretation, not a bare statistic.
Pattern and conclusion workflow
Describe direction, shape, range, key values, variation and anomalies before explaining. Then answer the aim and judge hypothesis support.
Use relevant theory from the syllabus to explain the mechanism. Avoid claiming causation from correlation or uncontrolled field association.
Calibrate confidence from range, intervals, replication, controls, standardisation, measurement quality and statistical evidence.
State the scope: organism, site, conditions and time represented by the data.
Evaluation workflow
For each limitation, write:
specific method feature to error mechanism to effect on result or confidence to matched improvement
Prioritise the largest relevant limitations rather than listing generic care. Explain random or systematic direction where possible.
Keep an improvement to the same aim separate from an extension to another variable, organism or context.
If asked to evaluate a supplied conclusion, assess both its data support and method validity.
Use unfamiliar information actively
Translate a new apparatus description into what it measures, its range, resolution and limitations. Translate a photograph into observable evidence and scale. Translate a map into location, distance, distribution and sampling frame.
Do not ignore supplied facts in favour of memorised notes. Application marks often depend on using the new information.
When an unfamiliar result conflicts with expectation, report it honestly and consider mechanism, anomaly and method evidence.
Transfer theory at the appropriate level of detail, respecting any stated exclusions.
Manage time by task risk
Scan the paper and recognise tasks with setup cost: full graphs, drawings, statistical tables and extended plans. Leave enough time to complete their structural requirements.
Work steadily in paper order unless a clear personal strategy has been practised. If stuck, leave a visible gap and return rather than erasing completed evidence.
Use a short final check for units, significant figures, graph keys, table headings, drawing labels, statistical decisions and unanswered subparts.
No fixed minutes-per-mark rule overrides the complexity of a graph or plan.
Paper 2 emphasis
Expect structured prompts that guide parts of planning, calculation and evaluation. Use the scaffolding fully and avoid answering a later part prematurely in an earlier box.
AS statistics and Topics 1 to 5 practical transfer are central. Biological drawing, tables and graphs can be directly produced.
Knowledge recall normally supports data or investigation context rather than standing alone.
Short answers still require precise units, evidence and terminology.
Paper 4 emphasis
Expect less scaffolding, more extended planning and evaluation, A Level statistical uncertainty and chi-squared, magnification or scale, and Topics 6 to 9 theory with relevant AS transfer.
Build an internal checklist before writing a long plan so controls, replication, ethics, table and analysis are not omitted.
Connect AS foundations such as sampling or water properties when the A Level context requires them.
Extended writing should remain operational and evidence-led rather than becoming an essay on theory.
Final verification checklist
Before finishing, check:
every subpart has an answer
numerical answers have working, unit and justified significant figures
tables contain raw values and units in headings
graphs have correct axes, scale, points, line treatment and key
drawings are large, unshaded, labelled correctly and scaled if required
statistical conclusions use the correct null decision
evaluations link limitation, effect and improvement
plans include range, replicates, control, safety, ethics and analysis
This is error prevention, not an invitation to change unexpected data.
Worked application: integrating a Paper 4 investigation
A source proposes five pH treatments for empty shells and supplies replicate mass data. First identify pH as independent variable and mass loss as dependent response. Audit shell area, solution volume, temperature, exposure time and drying. Construct one raw table, calculate each loss and mean, then plot mean loss against pH with the stated error bars. Describe the pattern and variation before explaining carbonate chemistry. If middle treatments overlap widely, limit confidence rather than claiming no relationship everywhere. A full plan adds verified pH, independent shell pieces, random allocation, controlled temperature, hazard-specific solution handling and constant-mass drying. Evaluation links residual water to an underestimated loss and repairs it by repeated dry-cool-weigh cycles. A separate extension tests mineral composition, not merely another repair to the pH aim.
Common misconceptions and corrections
Treating Paper 2 as theory recall only. AO2 and AO3 are central.
Treating Paper 4 as Topics 6 to 9 only. Relevant AS knowledge can be required.
Assuming Paper 2 and Paper 4 have identical scaffolding. Paper 4 is less scaffolded.
Memorising practical scripts without transferable principles. Unfamiliar contexts require adaptation.
Ignoring a supplied apparatus description. It defines available technique.
Starting calculation before checking units. The wrong row or prefix can invalidate it.
Writing an explanation for a describe command. Establish the pattern first.
Repeating one point for several marks. Give distinct linked elements.
Writing a full essay for one mark. Match scope to command and allocation.
Omitting at least five values from a full plan. The official planning minimum applies.
Listing apparatus without how it is used. Operation creates reproducibility.
Using one table per treatment. Keep one coherent results table.
Putting units in every table cell. Put them in headings.
Using a line graph for categories. Choose from data type.
Forcing every plotted point into a smooth curve. Represent the central pattern.
Adding an unlabeled error bar. Its statistic is unknown.
Shading a biological drawing. Official drawings are unshaded.
Using arrowheads on label lines. Use straight ruler lines without arrows.
Dividing image and actual size in different units. Convert first.
Reporting every calculator digit. Final precision must be justified.
Using Paper 4 chi-squared in an AS-only answer. Preserve level boundaries.
Forgetting chi-squared degrees of freedom. Recall classes minus one.
Giving a statistical value without a decision. Compare with the supplied critical value.
Explaining a graph without quoting evidence. Use values and variation.
Writing "human error" in evaluation. Name the mechanism.
Giving an improvement unrelated to the limitation. Break the identified cause.
Calling a new variable an improvement. It is an extension.
Ignoring practical ethics in a plan. Ethical treatment is explicit.
Using a rigid timing rule for every task. Graphs and plans have different setup costs.
Changing an unexpected answer during final checking without evidence. Verify rather than fabricate.
Leaving a source figure or footnote unread. It may set the entire interpretation.
Assessment guidance
Treat each paper as an evidence workflow, not a collection of isolated tricks. On Paper 2, use the structured prompts to apply Topics 1 to 5 practical knowledge, AS calculations, tables, graphs and drawings. On Paper 4, independently build extended plans and evaluations, add A Level statistics, magnification and Topics 6 to 9 mechanisms while retaining relevant AS foundations. Read source information and command words before answering. For every constructed product, apply its full contract: reproducible plan, single raw table, data-appropriate graph, compliant drawing, transparent calculation, assumption-aware statistic, evidence-led conclusion or causal evaluation. Reserve a final check for units, significant figures, labels, null decisions and missing subparts.
Retrieval practice
Map all thirteen official practical activities to variables, apparatus, raw record, expected display, theory and limitation. Then complete one Paper 2-style structured investigation and one Paper 4-style extended investigation from source reading through plan, table, graph or drawing, calculation, statistics, conclusion and evaluation. Finish by auditing both responses against the final verification checklist and explaining every difference in level demand.