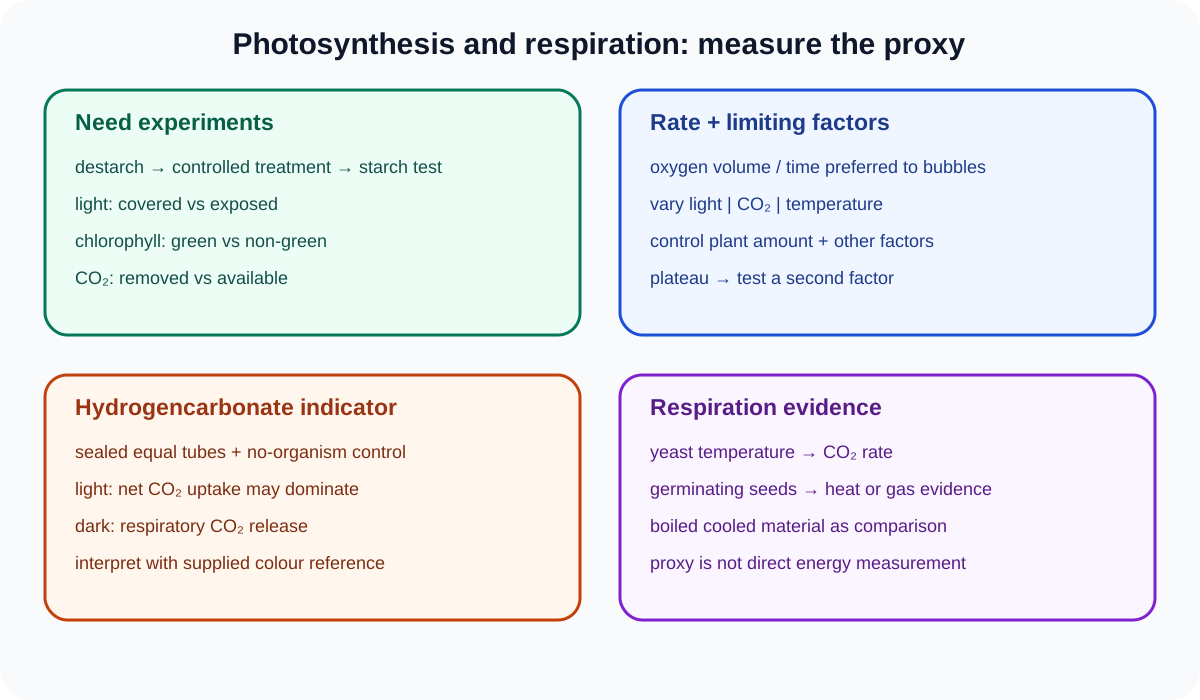
Cambridge IGCSE Biology 0610 and 0970 require investigations of chlorophyll, light and carbon dioxide need, photosynthesis rate under three named factors, aquatic-plant gas exchange in light and dark, and temperature effects on yeast respiration. Papers 5 and 6 also assess photosynthesis, limiting factors and respiration as general practical contexts.
Distinguish the process from its proxy
Photosynthesis rate may be inferred from oxygen bubbles, collected gas volume, carbon-dioxide indicator or starch formed after a treatment. Respiration may be inferred from carbon dioxide, oxygen use, temperature increase or a redox indicator.
Each measurement is a proxy. Bubble count is not glucose concentration. Indicator colour is not a direct gas-volume reading. State what was measured and how it supports the biological inference.
Plants respire continuously, including in light. Photosynthesis and respiration can occur together, so gas measurements often show net exchange rather than either process alone.
Test a leaf for starch
Heat the leaf in water as instructed to stop reactions and soften tissue. Then heat it in ethanol using a hot-water bath to remove chlorophyll. Rinse the brittle leaf in water, spread it on a white tile and add iodine solution.
A blue-black region contains detectable starch; a region remaining orange-brown does not. Decolourising the leaf makes the iodine result visible.
Ethanol is flammable. Keep it away from flames and do not heat it directly. Use eye protection, suitable holders and the supplied safety procedure.
Test the need for light
Destarch a plant by keeping it in darkness long enough for stored starch to be used. Cover part of a leaf on both surfaces with opaque material, then expose the plant to light.
After the starch test, the exposed region should turn blue-black while the covered region remains orange-brown if light was needed under the conditions.
The uncovered portion is an internal control on the same leaf. The cover should exclude light without damaging the tissue. Destarching matters because pre-existing starch could create a positive result in the covered area.
Test the need for chlorophyll
Use a destarched plant with variegated leaves and record which regions are green before decolourising. Expose the plant to light, then perform the starch test.
Green regions containing chlorophyll should form starch and turn blue-black, while non-green regions should remain orange-brown if other conditions are suitable.
Marking the pattern before ethanol treatment is essential because chlorophyll colour is removed. Green and non-green regions on the same leaf provide a useful comparison.
Check this topic from memory
Attempt the matching topic bank before reopening the notes. Use each missed idea to decide what to review next.
Place similar destarched plants in separate transparent sealed conditions with equal light, temperature and time. One condition removes carbon dioxide using the instructed absorbent; the control retains available carbon dioxide.
After exposure, test comparable leaves for starch. A negative result in the carbon-dioxide-depleted condition and positive control support the need for carbon dioxide.
The setup must be sealed, and the absorbent should not contact or damage the leaf. A control without the removing agent separates carbon-dioxide availability from enclosure effects.
Measure photosynthesis rate using an aquatic plant
Use the same species and length of aquatic shoot, with a freshly cut end positioned consistently. Provide sodium hydrogencarbonate when a controlled carbon-dioxide source is required.
Count bubbles in a fixed time or collect gas volume. Gas volume is usually stronger because bubbles differ in size. Repeat at each condition and calculate a mean.
Allow the plant to acclimatise after changing a condition. Early readings may reflect the previous environment. Keep measurement time, plant size, carbon-dioxide supply and other named factors constant.
Confirming that the collected gas relights a glowing splint may identify oxygen when that test is supplied, but follow the exam method and safety instructions.
Vary light intensity
Move a lamp to measured distances or use a controlled light source. Distance is directly controlled; light intensity changes with distance but is not numerically equal to it.
Keep temperature constant because a nearby lamp can warm the plant. Use a heat shield, water bath or monitored temperature as appropriate. Exclude or standardise background light.
At low light intensity, increasing light may increase rate. A plateau suggests another factor limits the rate. Do not claim which factor without relevant evidence.
Vary carbon dioxide concentration
Prepare defined sodium hydrogencarbonate concentrations while keeping total volume, plant material, light and temperature constant. Allow equilibration and use the same rate measure.
Increasing carbon-dioxide availability may raise rate until another factor limits it. Sodium hydrogencarbonate concentration is an experimental way to change carbon-dioxide supply; do not call it plant food.
Vary temperature
Use a controlled water bath across a safe range, allow plant and solution to reach each temperature, and measure actual temperature.
Keep light and carbon-dioxide supply constant. Rate may rise as enzyme-controlled reactions accelerate, then fall at excessive temperature due to enzyme denaturation or tissue stress.
If light output or gas solubility also changes, interpretation becomes more complex. The method should isolate temperature as far as possible.
Use hydrogencarbonate indicator
Hydrogencarbonate indicator shows relative carbon-dioxide concentration. Use the colour reference supplied with the question. Commonly, purple indicates lower carbon dioxide than atmospheric, red-orange represents an atmospheric reference and yellow indicates higher carbon dioxide.
Place equal plant material in equal indicator volumes under light and dark conditions for the same time and temperature. Include indicator without an organism as a control.
In bright light, photosynthesis may remove carbon dioxide faster than respiration releases it, giving a lower-carbon-dioxide colour. In darkness, photosynthesis stops while respiration releases carbon dioxide, giving a higher-carbon-dioxide colour.
Seal tubes where instructed to limit exchange with external air. Compare against the supplied reference rather than relying only on remembered colours.
Investigate respiration in yeast
Prepare equal yeast and glucose mixtures and place them at different controlled temperatures. Measure carbon-dioxide production over a fixed time, collect gas volume, count gas bubbles with stated limitations or use another supplied indicator method.
Equilibrate mixtures before starting, keep yeast amount, glucose concentration and volume, pH, total volume and time constant, and use repeats.
Rate should rise to an optimum as enzyme-controlled reactions accelerate, then decrease if high temperature denatures enzymes or kills yeast cells. Low temperature slows respiration rather than denaturing enzymes.
If anaerobic conditions are intended, limit oxygen consistently. Do not call carbon-dioxide evidence proof of aerobic respiration because yeast can release carbon dioxide anaerobically.
Use germinating seeds as respiration evidence
Germinating seeds respire and may produce a measurable temperature increase in an insulated container. Use an equal mass of boiled, cooled seeds or inert material as a comparison while controlling starting temperature, volume, insulation and time.
Boiled seeds must be cooled before the experiment. Otherwise their retained heat invalidates the control. A disinfectant may be specified to reduce microbial respiration, but use only the instructed material and concentration.
Limewater can support carbon-dioxide detection, while an oxygen or redox indicator can support oxygen-use evidence when supplied. Interpret the named observation without claiming direct energy measurement.
Identify limiting factors from data
A limiting factor is in shortest supply relative to demand and restricts photosynthesis rate. If increasing light raises rate, light was limiting over that range. If the curve plateaus, light is no longer the only limiting factor.
To identify the new limiting factor, compare curves at different carbon-dioxide concentrations or temperatures. A higher plateau after increasing carbon dioxide supports carbon dioxide limitation in the original condition.
One graph point does not reveal a complete limiting-factor mechanism. Use comparisons and qualify conclusions to the tested range.
Evaluate rate evidence
Bubble sizes vary, so collected gas volume is preferable where possible. Gas may dissolve in water, apparatus may leak and a freshly cut shoot may change activity over time.
Lamp heating confounds light experiments. Failure to acclimatise creates carry-over. Unequal plant length or leaf area creates biological differences. Standardise material, monitor temperature, randomise order or use independent replicates where appropriate.
Indicator colours are semi-quantitative and subjective. Use standard colours, consistent lighting or a colorimeter. Repeats improve reliability but do not correct unsealed tubes or an inappropriate control.
Worked application: interpret two light-response curves
At low carbon-dioxide concentration, oxygen volume rises from 2 to 6 cm³ per five minutes as lamp distance decreases, then plateaus. At higher carbon-dioxide concentration, the same light change raises volume from 3 to 10 cm³ before a higher plateau. Light limits both treatments initially. Carbon dioxide limits the first treatment at higher light because extra carbon dioxide raises the plateau. The second plateau shows that another factor now limits rate. Temperature must be monitored near the lamp before attributing all change to light, and gas volume should be repeated with equal plant material.
Common misconceptions and corrections
Calling oxygen bubbles a direct glucose measurement. They are a gas proxy.
Assuming equal bubble number means equal gas volume. Bubble sizes vary.
Saying plants do not respire in light. Respiration continues.
Calling a light result gross photosynthesis automatically. It may represent net gas exchange.
Testing a leaf without destarching. Stored starch can confound the result.
Covering only one leaf surface loosely. Light may enter the test region.
Calling the covered region a different leaf control. It is an internal comparison on the same leaf.
Forgetting to mark variegated regions. Ethanol removes the green pattern.
Saying non-green tissue proves light is absent. The variable is chlorophyll.
Leaving the carbon-dioxide apparatus open. External gas can enter.
Allowing absorbent to damage the leaf. Separate it physically.
Heating ethanol directly. Use a water bath and avoid flames.
Saying ethanol tests for starch. It removes chlorophyll.
Calling sodium hydrogencarbonate food. It changes carbon-dioxide supply.
Equating lamp distance numerically with intensity. It is a distance proxy.
Ignoring lamp heating. Temperature can confound the result.
Changing plant length between trials. Standardise photosynthetic material.
Taking readings immediately after a change. Allow acclimatisation.
Claiming a plateau means photosynthesis stops. Rate may be limited at a steady value.
Naming a limiting factor without comparison evidence. Use changed-condition curves.
Reading indicator colours without a reference. Use the supplied scale.
Saying purple means more carbon dioxide. It commonly indicates lower concentration.
Saying darkness stops all plant metabolism. Respiration continues.
Calling yeast carbon dioxide proof of aerobic respiration. Anaerobic yeast also releases it.
Placing yeast directly at a new temperature and timing immediately. Equilibrate conditions.
Saying low temperature denatures yeast enzymes. It slows reactions.
Using hot boiled seeds as a control. Cool them to the same start temperature.
Calling temperature rise direct energy measurement. It is evidence of released heat.
Using repeats to fix a gas leak. Seal the apparatus.
Generalising one plant species to all plants. Qualify the tested scope.
Assessment guidance
Need experiments must use destarched material, an appropriate comparison and a complete starch-test observation. Rate plans should define the proxy, control plant amount, gas supply, time and temperature, and distinguish lamp distance from light intensity. Hydrogencarbonate-indicator answers need equal material, sealed conditions, a no-organism control and interpretation through relative carbon dioxide. Yeast-temperature plans require equilibration and controlled mixture composition. For limiting factors, use comparative curves to identify what restricts rate over a stated range. Evaluation should connect bubbles, dissolved gas, heating, acclimatisation, leaks or subjective colour to a targeted improvement.
Retrieval practice
Reconstruct controlled experiments for light, chlorophyll and carbon-dioxide need, including destarching and starch-test safety. Plan three aquatic-plant rate series and one yeast-temperature series. Interpret hydrogencarbonate colours in light and dark, compare limiting-factor curves and diagnose lamp heating, unequal plant material, gas leaks, dissolved oxygen, carry-over and subjective indicator endpoints.
Theory and practical ownership
This practical note owns photosynthesis and respiration investigations, proxies, controls, hazards, rate processing, limiting-factor evidence and evaluation. The plant-nutrition and respiration theory notes own molecular equations and mechanisms. The data-skills note owns general graph construction.