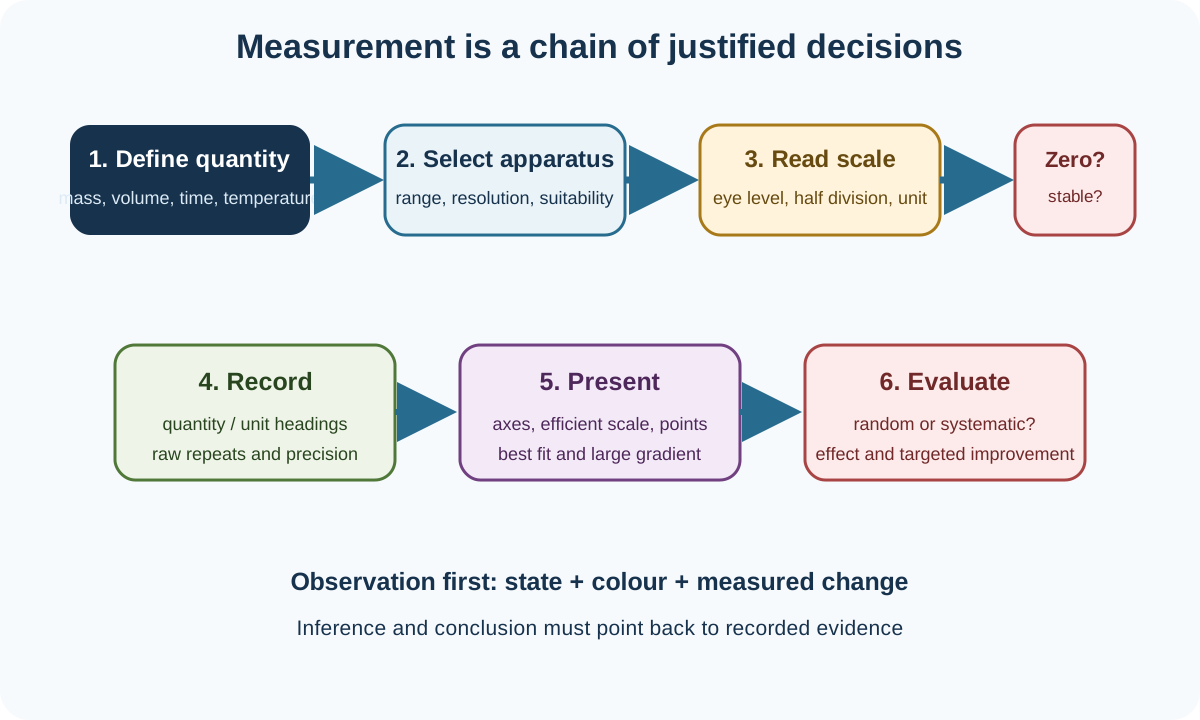
Practical Skill 1 develops the measurement and apparatus decisions shared by Cambridge IGCSE Chemistry Papers 5 and 6. The official boundary combines section 12.1 Experimental design with AO3 requirements for selecting apparatus, reading analogue and digital instruments, recording systematic data, presenting graphs and judging measurement quality.
Choose apparatus from the measured quantity
Start by identifying what must be measured and whether the task needs a fixed value, variable delivery, continuous tracking or approximate transfer.
Quantity or task
Appropriate apparatus
Key reason
time
stopwatch
direct interval measurement
temperature
thermometer
suitable scale and range
mass
balance
direct digital or analogue mass reading
fixed accurate liquid volume
volumetric pipette
transfers one calibrated volume
variable accurate liquid volume
burette
Check this topic from memory
Attempt the matching topic bank before reopening the notes. Use each missed idea to decide what to review next.
A beaker or conical flask is valuable for holding, mixing or heating but is not normally chosen for accurate volume measurement. A volumetric pipette is accurate for one fixed volume but cannot measure a changing unknown volume.
Range, resolution and suitability
Range is the span an instrument can measure. Resolution is the smallest change its scale can distinguish.
Choose an instrument with enough capacity but not a needlessly large range. Measuring 8 cm³ in a 10 cm³ cylinder normally gives finer resolution than using a 100 cm³ cylinder.
Suitability also includes material compatibility, safe operating temperature, gas tightness and whether the apparatus introduces delay or loss. A gas syringe must have sufficient capacity and move freely; a balance method requires gas to escape if loss of mass is the dependent variable.
Accuracy is closeness to the accepted value. Precision is closeness among repeated measurements or fineness in reported readings. High precision does not guarantee accuracy if a systematic offset affects every result.
Read an analogue scale
The Cambridge presentation contract expects values read to the nearest half of the smallest scale division where interpolation is required.
Identify the values and direction of the scale.
Calculate the smallest division from labelled marks.
Position the eye level with the indicator or liquid surface.
Read the correct point, commonly the bottom of a concave aqueous meniscus.
Interpolate only to the nearest half division.
Record the unit and precision consistently.
If a thermometer has 1 °C divisions, an intermediate value may be read to 0.5 °C. Reporting 23.417 °C invents unsupported precision.
Parallax occurs when the eye is above or below the reading level, making the apparent position shift. The targeted precaution is to place the eye perpendicular to and level with the scale.
Read digital instruments
Wait for a stable display where appropriate, check zero before use and record all digits supplied by the instrument. A balance displaying 2.30 g supports two decimal places; rewriting it as 2.3 g discards indicated precision.
Tare the balance with an empty container when the required measurement is sample mass. Check that the maximum capacity will not be exceeded and protect the pan from hot or wet material.
A digital value can still be inaccurate through poor calibration, drift or incorrect zeroing. Digital does not mean error-free.
Record systematic tables
Place the independent variable in the first column and dependent measurements in subsequent columns. Each heading needs the quantity or symbol, a solidus and the unit, such as time / s or temperature / °C.
Do not write units in every data cell. Use consistent decimal places down a column when readings come from the same instrument. Include repeats and a mean only where appropriate, while retaining raw readings so variation remains visible.
Calculated results should use the same number of significant figures as the least precise raw value used in that calculation. Ratios should be written as x : y.
Separate observation from inference
An observation records direct evidence:
colourless bubbles form
a blue precipitate appears
temperature rises from 22.0 °C to 28.5 °C
a silver solid is deposited on the electrode
An inference interprets evidence:
gas was produced
copper(II) ions may be present
the reaction transferred thermal energy to the surroundings
When asked what is seen, write colour, state and change. “A reaction occurred” is an inference and is too vague.
Draw and interpret graphs
Plot the independent variable on the x-axis and dependent variable on the y-axis unless directed otherwise. Transfer table headings to axes, including units.
Choose simple scales based on 1, 2 or 5 times powers of ten and use more than half the available grid in both directions. Mark small crosses or encircled dots accurately to half a small square.
Draw one thin best-fit straight line or smooth curve with a roughly even distribution of non-anomalous points. Do not join every point. Clearly anomalous values can be excluded from the trend but should remain plotted.
Use interpolation within the measured range more confidently than extrapolation beyond it. Determine a straight-line gradient with a triangle spanning at least half the best-fit line. Gradient units come from y-axis units divided by x-axis units.
Repeats, means and anomalous values
Repeats reveal random variation and allow a representative mean. They do not automatically remove a systematic error shared by every reading.
Identify an anomaly from its inconsistency with repeats or the overall trend, not because it looks inconvenient. Repeat the measurement if possible. If a justified anomaly is excluded from a mean or best-fit line, state that decision.
More repeat readings improve confidence in random variation. More independent-variable values improve definition of a trend. These solve different problems.
Heating and basic handling
Wear eye protection. Point open test tubes away from people, use a holder and heat gently while moving the tube through the flame. Keep flammable substances away from ignition sources.
When comparing heating, keep container, volume, starting temperature, heat source, distance and time constant unless one is the independent variable.
Safety answers should join hazard, mechanism and precaution. “Wear goggles” is stronger when linked to corrosive splash risk and eye protection.
Worked application: design a gas-volume data set
A student compares calcium-carbonate particle size using equal 2.00 g samples and 25.0 cm³ of the same acid. A 100 cm³ gas syringe is selected because carbon dioxide volume changes continuously and the predicted maximum fits its range. The syringe is checked for free movement and an airtight seal. Volume is read at eye level every 10 s to the nearest half division, using headings time / s and gas volume / cm³. Three repeats are recorded for each size before calculating means. Mean volume is plotted against time, initial gradients are compared, and any low-volume run is investigated for leakage rather than labelled vaguely as human error.
Common misconceptions and corrections
Choosing a beaker for accurate volume. Use calibrated volumetric apparatus.
Calling a pipette suitable for any variable volume. It transfers one fixed volume.
Choosing the largest measuring cylinder. Use the smallest suitable range.
Equating resolution with accuracy. They describe different qualities.
Saying digital instruments have no error. Zero and calibration still matter.
Reading from above the meniscus. Place the eye level with it.
Reading every liquid at its top edge. Use the specified meniscus convention.
Reporting more digits than the scale supports. Interpolate only to half a division.
Dropping a trailing zero from digital data. Preserve displayed precision.
Putting units in every table cell. Put them in the heading.
Mixing decimal places in one instrument column. Record consistently.
Averaging before showing raw repeats. Retain the evidence.
Calling a colourless solution clear with no state. Record colour and state precisely.
Writing “reaction happened” as an observation. State visible or measured change.
Joining graph points dot to dot. Draw a best-fit line or curve.
Forcing the best-fit line through the origin. Do so only when evidence or instruction supports it.
Using awkward graph scales such as 3 or 7. Prefer simple 1, 2 or 5 progressions.
Calculating gradient from a tiny triangle. Use at least half the line.
Deleting an anomaly without justification. Investigate or repeat it.
Saying repeats fix systematic error. They mainly expose random variation.
Writing “human error”. Name the action and effect.
Assessment guidance
Apparatus questions reward choice plus justification: connect quantity, range, resolution and procedure. For scale diagrams, show how the smallest division was found and report the half-division reading with unit. Tables need quantity-unit headings, raw repeats and consistent precision. Observation answers should give state, colour and change without premature identification. Graphs need labelled axes, efficient scales, accurate points and a single best-fit trend. Evaluation should distinguish random scatter, anomalies and systematic bias, then propose a change that addresses the named mechanism. Avoid generic claims such as “use better equipment” unless the replacement and its measurement advantage are specified.
Retrieval practice
Match twelve measurements to apparatus and justify each choice. Read ten unfamiliar scales to half a division. Build tables from three raw-data sets, preserving precision and units. Plot one straight and one curved relationship, identify an anomaly, calculate a large-triangle gradient and compare interpolation with extrapolation. Rewrite ten vague observations and evaluation comments into evidence-based statements.
Theory and practical ownership
This practical note owns apparatus choice, readings, recording, observations, graph construction and measurement evaluation. The Chemistry theory hub owns particle models, equations, reaction mechanisms and conceptual explanations that justify expected results.