Cambridge IGCSE Chemistry Notes 5: Chemical Energetics
Cambridge IGCSE Chemistry Notes 5: Chemical Energetics
Study guide/
Cambridge IGCSE Chemistry 0620 and 0971 notes on exothermic and endothermic reactions, pathway diagrams, activation energy, enthalpy and bond energies.
Topic 5 of Cambridge IGCSE Chemistry 0620 and 0971 studies thermal-energy transfer during reactions. Official section 5.1 requires classification from surroundings, interpretation and construction of reaction pathways, enthalpy sign, activation energy, bond breaking and making, and calculation from bond energies.
Define the system and surroundings
The reacting chemicals form the system. Everything outside them is the surroundings. A thermometer usually measures the surroundings, often the solution and container, rather than directly measuring the reacting particles.
An exothermic reaction transfers thermal energy from the system to the surroundings. The surroundings become warmer, so their measured temperature increases.
An endothermic reaction takes in thermal energy from the surroundings. The surroundings become cooler, so their measured temperature decreases.
Temperature change is evidence about transfer direction. A temperature rise does not mean the reacting system has gained energy overall; it means the measured surroundings have gained thermal energy.
Enthalpy change and sign
The transfer of thermal energy during a reaction is called the enthalpy change, ΔH, of the reaction.
exothermic reaction: ΔH < 0
endothermic reaction: ΔH > 0
The sign is defined from the system's energy change. An exothermic system loses energy to the surroundings, so products lie at lower energy than reactants and ΔH is negative.
An endothermic system gains energy from the surroundings, so products lie at higher energy than reactants and ΔH is positive.
Reaction pathway diagrams
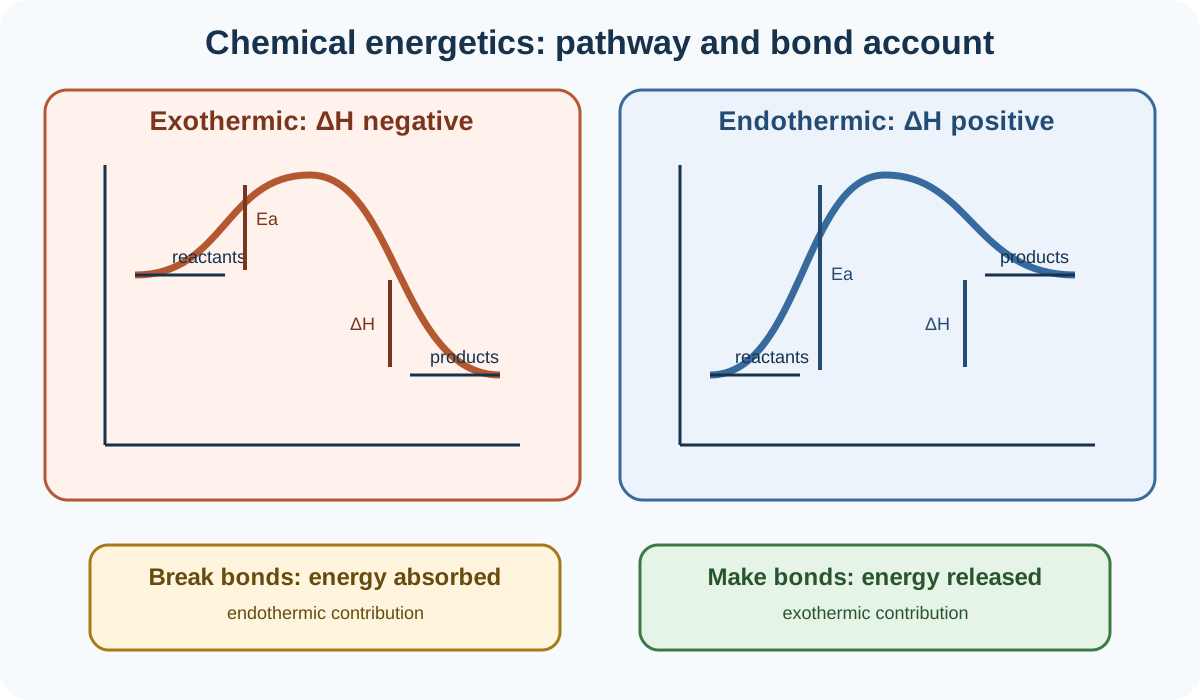
A reaction pathway diagram plots energy on the vertical axis and progress of reaction on the horizontal axis. Progress of reaction is not time. The curve is an energy route from reactants through a high-energy region to products.
For an exothermic pathway:
reactants begin at a higher energy level than products
the curve rises to a peak before falling
ΔH is drawn downward from reactant level to product level
ΔH is negative
For an endothermic pathway:
products end at a higher energy level than reactants
the curve still rises to a peak
ΔH is drawn upward from reactant level to product level
ΔH is positive
Check this topic from memory
Attempt the matching topic bank before reopening the notes. Use each missed idea to decide what to review next.
The vertical separation between reactants and products is the overall enthalpy change. It is not the height of the curve's peak.
Activation energy
Activation energy, Ea, is the minimum energy that colliding particles must have to react.
On a pathway diagram, forward activation energy is measured vertically from the reactant energy level to the peak. It is not measured from the bottom of the graph and not from products unless reverse activation energy is requested.
Both exothermic and endothermic reactions require activation energy. Even an energy-releasing reaction may need heating, a spark or another initial input because existing bonds and particle arrangements must begin changing before new products form.
The role of catalysts in lowering activation energy belongs primarily to Topic 6, Chemical reactions. In this topic, the core diagram skill is to distinguish Ea from ΔH accurately.
Interpret numerical energy levels
Suppose reactants lie at 120 kJ/mol, the pathway peak at 280 kJ/mol and products at 70 kJ/mol.
Forward activation energy is 280 - 120 = 160 kJ/mol. Enthalpy change is 70 - 120 = -50 kJ/mol, so the reaction is exothermic.
If a diagram uses arbitrary energy units, do not invent kJ/mol. Report the units given or compare levels qualitatively.
Bond breaking and bond making
Bond breaking is endothermic because energy must be supplied to overcome attraction between bonded atoms.
Bond making is exothermic because energy is released when atoms form more stable bonded arrangements.
Every ordinary chemical reaction involves both processes. Classification depends on their balance:
if forming product bonds releases more energy than breaking reactant bonds absorbs, the reaction is exothermic
if breaking reactant bonds absorbs more energy than forming product bonds releases, the reaction is endothermic
Do not assign a single overall sign merely because one strong bond appears. Count all relevant bonds and compare total inputs with total releases.
Calculate ΔH from bond energies
Average bond energies estimate the enthalpy change:
ΔH = total energy to break reactant bonds - total energy released when product bonds form
Use the displayed structural formula or count bonds carefully from the balanced equation.
For H₂ + Cl₂ → 2HCl, suppose bond energies are H-H = 436 kJ/mol, Cl-Cl = 243 kJ/mol and H-Cl = 431 kJ/mol.
Break one H-H and one Cl-Cl bond:
energy in = 436 + 243 = 679 kJ/mol
Form two H-Cl bonds:
energy out = 2 × 431 = 862 kJ/mol
Therefore:
ΔH = 679 - 862 = -183 kJ/mol
The negative answer agrees with the fact that bond making releases more energy than bond breaking absorbs.
Count bonds without changing the equation
Coefficients multiply every molecule and therefore every bond within it. Subscripts describe atoms within one formula. For 2H₂ + O₂ → 2H₂O, reactants contain two H-H bonds and one O=O bond. Products contain four O-H bonds because each of two water molecules has two O-H bonds.
Do not include attractions between separate simple molecules in a bond-energy calculation unless the question supplies and requests such data. Cambridge's section 5.1 calculation uses the bond energies provided.
Connect calculated and experimental evidence
Bond-energy values are commonly average values, so a calculated ΔH can differ from an experimental result. The calculation is still useful for predicting sign and approximate magnitude.
Practical temperature changes can also be smaller than ideal because energy transfers to the container or wider surroundings, a reaction may be incomplete, substances may escape, or measurements may miss the true maximum or minimum. Those method and evaluation details belong in the practical hub, but they explain why observation and ideal calculation need not match exactly.
Worked application: read a pathway and test it with bonds
For CH₄ + 2O₂ → CO₂ + 2H₂O, a pathway shows reactants at 80 units, a peak at 330 units and products at 20 units. Forward Ea is 330 - 80 = 250 units; ΔH is 20 - 80 = -60 units, so products are lower and the reaction is exothermic. A bond calculation must break four C-H and two O=O bonds, then form two C=O bonds in CO₂ and four O-H bonds in two water molecules. If formation releases the greater total, the calculated negative sign supports the diagram. Ea and ΔH remain different quantities.
Common misconceptions and corrections
Calling an exothermic system hotter by definition. Energy transfer warms the surroundings.
Saying an endothermic reaction releases heat. It takes in thermal energy.
Using temperature change without naming surroundings. State where energy moves.
Giving exothermic ΔH a positive sign. The system loses energy, so it is negative.
Giving endothermic ΔH a negative sign. The system gains energy, so it is positive.
Treating progress of reaction as time. It is a reaction coordinate.
Drawing exothermic products above reactants. They lie lower.
Drawing endothermic products below reactants. They lie higher.
Measuring Ea from the bottom of the axis. Measure from reactants to the peak.
Calling the reactant-product gap activation energy. That gap is ΔH.
Saying exothermic reactions need no initial energy. They still have Ea.
Defining Ea as energy released. It is the minimum collision energy for reaction.
Saying bond breaking releases energy. Breaking absorbs energy.
Saying bond making absorbs energy. Making releases energy.
Counting only bonds broken. Include bonds formed.
Reversing the bond-energy subtraction. Use broken minus formed.
Ignoring equation coefficients when counting bonds. Coefficients multiply molecules.
Changing a formula to simplify bond counting. Preserve the balanced chemical equation.
Calling a negative calculation endothermic. Negative ΔH is exothermic.
Attaching units when the graph provides none. Use the stated units only.
Expecting average bond energies to reproduce an experiment exactly. They provide an estimate.
Blaming every discrepancy on human error. Identify a directional mechanism.
Assessment guidance
For classification, state the direction of thermal-energy transfer and the resulting surroundings temperature change. On diagrams, label axes, reactants, products, Ea and ΔH, then use relative levels to justify the sign. In numerical pathway questions, write separate subtractions for Ea and ΔH. For bond-energy calculations, copy the balanced equation, count each bond in a clear broken-versus-formed table, multiply by the supplied energy, and use broken - formed. Interpret the sign in words and check that it matches the larger total. Do not import catalyst claims into a question that asks only about the uncatalysed energy pathway.
Retrieval practice
Classify six observations as exothermic or endothermic with a system-surroundings explanation. Draw and label both pathway types from memory, then calculate Ea and ΔH from four sets of energy levels. Count bonds for combustion of hydrogen, methane and ethene. Complete three supplied bond-energy calculations and explain why an estimated value may differ from a practical temperature result.
Theory and practical ownership
This theory note owns energy-transfer definitions, pathway interpretation, enthalpy sign, activation energy and bond-energy calculation. The Chemistry practical hub owns calorimetry apparatus, temperature-time measurement, safe handling, heat-loss control, data processing and evaluation.