

Co-ordinated Sciences Chemistry C5: Chemical Energetics
Cambridge IGCSE Co-ordinated Sciences 0654 Chemistry C5 notes with worked examples, misconception checks and assessment guidance.
Chemistry C5 of Cambridge IGCSE Co-ordinated Sciences 0654 studies thermal-energy transfer during reactions. Official section C5.1 requires classification from surroundings, interpretation and construction of reaction pathways, enthalpy sign, activation energy, and the direction of energy transfer during bond breaking and bond making. Calculating enthalpy change from bond-energy data is outside this boundary.
Define the system and surroundings
The reacting chemicals form the system. Everything outside them is the surroundings. A thermometer usually measures the surroundings, often the solution and container, rather than directly measuring the reacting particles.
An exothermic reaction transfers thermal energy from the system to the surroundings. The surroundings become warmer, so their measured temperature increases.
An endothermic reaction takes in thermal energy from the surroundings. The surroundings become cooler, so their measured temperature decreases.
Temperature change is evidence about transfer direction. A temperature rise does not mean the reacting system has gained energy overall; it means the measured surroundings have gained thermal energy.
Enthalpy change and sign
The transfer of thermal energy during a reaction is called the enthalpy change, ΔH, of the reaction.
- exothermic reaction:
ΔH < 0 - endothermic reaction:
ΔH > 0
The sign is defined from the system's energy change. An exothermic system loses energy to the surroundings, so products lie at lower energy than reactants and ΔH is negative.
An endothermic system gains energy from the surroundings, so products lie at higher energy than reactants and ΔH is positive.
Reaction pathway diagrams
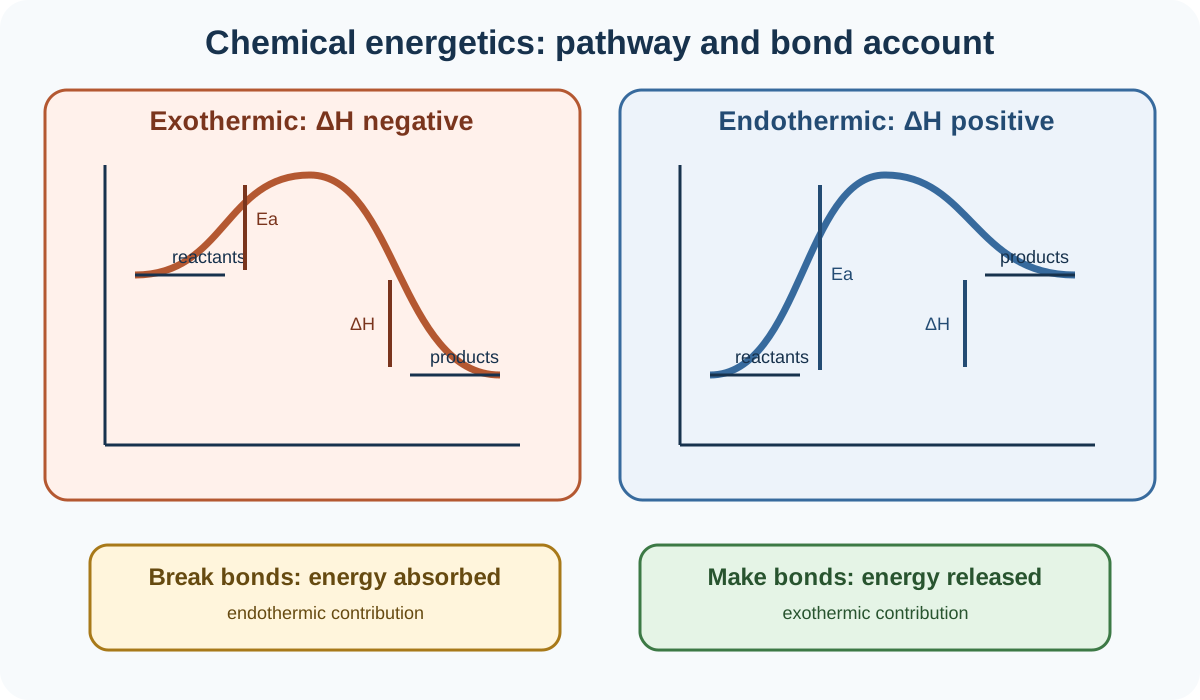
A reaction pathway diagram plots energy on the vertical axis and progress of reaction on the horizontal axis. Progress of reaction is not time. The curve is an energy route from reactants through a high-energy region to products.
For an exothermic pathway:
- reactants begin at a higher energy level than products
- the curve rises to a peak before falling
- ΔH is drawn downward from reactant level to product level
- ΔH is negative
For an endothermic pathway:
- products end at a higher energy level than reactants
- the curve still rises to a peak
Check this topic from memory
Attempt the matching topic bank before reopening the notes. Use each missed idea to decide what to review next.
Start the topic quiz