

Cambridge IGCSE Mathematics Notes 8: Probability
Cambridge IGCSE Mathematics notes on probability scales, combined events, tree diagrams, conditional probability and expected frequency.
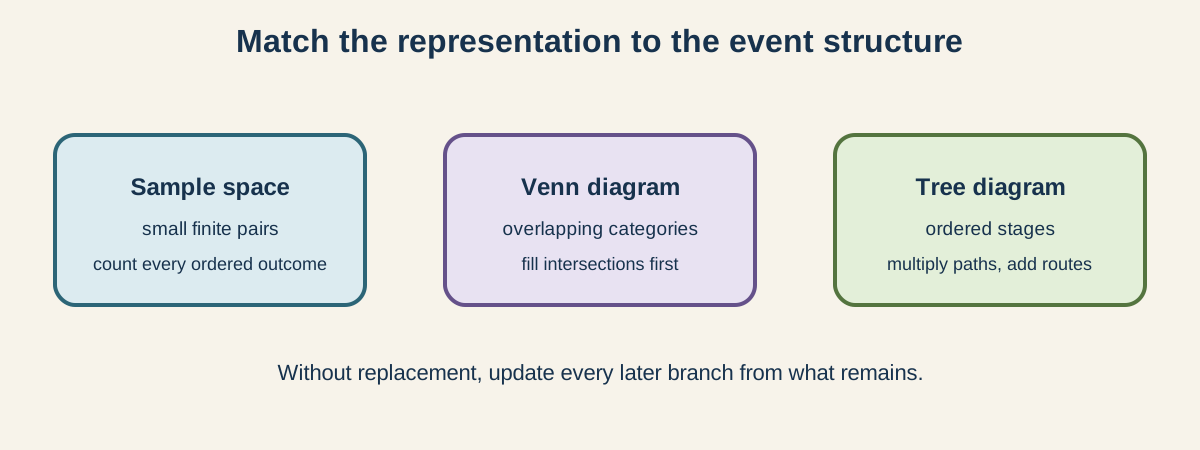
Cambridge IGCSE Mathematics 0580 Topic 9 covers single events, complements, experimental estimates, expected frequencies and combined events represented by sample spaces, Venn diagrams or trees. Core combined events use replacement only and do not require formal probability notation. Extended adds notation, up to three-set Venn work and events with or without replacement.
1. Probability scale and single events
Probability lies from 0 to 1 inclusive. Zero means impossible under the model, one means certain, and values nearer one indicate greater likelihood. Give a probability as a fraction, decimal or percentage, but not as odds unless requested.
For equally likely outcomes:
probability = favourable outcomes ÷ total possible outcomes
The equally likely condition matters. A spinner with unequal sectors cannot be modelled by counting colours alone. Use sector angles, areas or empirical evidence as appropriate.
Extended notation includes P(A) for event A and P(A') for its complement. Core candidates use the same ideas without needing the notation.
2. Complements and totals
An event and its complement exhaust all possibilities, so their probabilities total 1. The complement is useful for “at least one” questions: calculate the probability of none, then subtract from 1.
Probabilities on all branches leaving the same node of a tree must total 1. Regions in a complete Venn diagram, including the outside region, must also account for the whole sample space.
3. Relative frequency
Relative frequency is observed event frequency divided by number of trials. It estimates an unknown probability. Small experiments can vary substantially, while a larger number of well-conducted independent trials generally gives a more stable estimate.
Random describes an outcome process without a predictable individual result. Fair means outcomes have the intended equal chances. Bias means the mechanism or sampling process systematically favours some outcomes. Randomness does not automatically guarantee fairness.
Compare experimental results with a theoretical model using actual differences and sample size, rather than declaring a device unfair after one short run.
4. Expected frequency
Expected frequency is probability × number of trials or population size. It is a long-run model, not a promise that the exact number must occur. An expected frequency can be non-integer even though an observed count must be whole.
Reverse reasoning can estimate probability from a stated expected count. Keep the population and event definition aligned.
5. Sample-space diagrams
A sample-space table suits two finite stages such as two dice, two spinners or coin-and-die experiments. List every ordered pair exactly once. Use it to count sums, differences or other combined conditions.
Check this topic from memory
Attempt the matching topic bank before reopening the notes. Use each missed idea to decide what to review next.
Start the topic quiz