

Cambridge IGCSE Statistics 4: Measures of central tendency
Cambridge IGCSE Statistics 0479 notes on measures of central tendency.
Cambridge IGCSE Statistics 0479 Topic 4 covers the mean, median and mode for small data sets and frequency distributions, estimates from grouped data, the modal class, and justified selection of a measure in context.
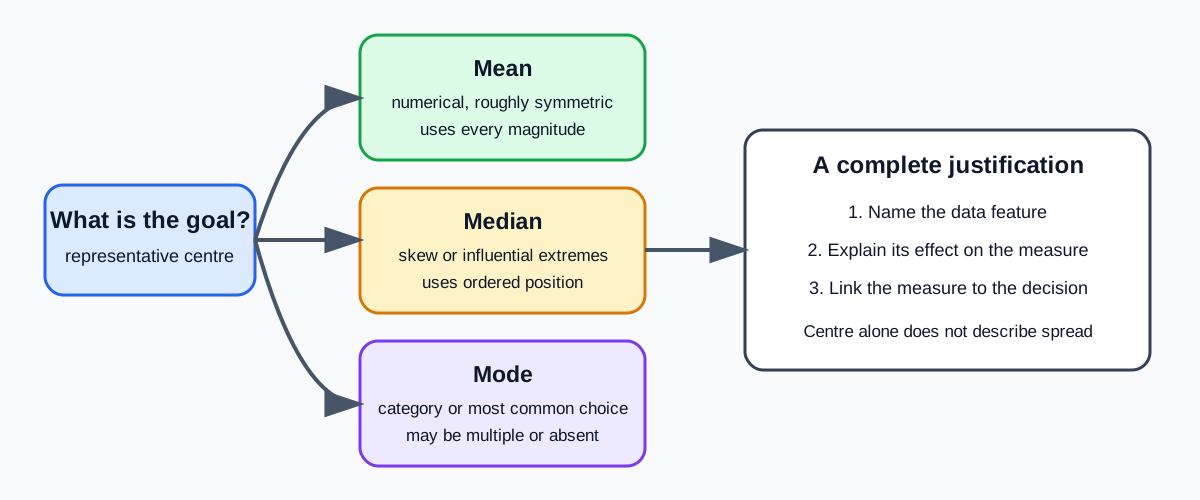
1. What central tendency describes
A measure of central tendency gives one representative location for a distribution. It does not describe spread, shape or sample size, so two data sets can share the same centre while differing substantially elsewhere.
The mean balances all numerical values. The median is the middle ordered position. The mode is the most frequent value or category. Select them according to the data and question, not by habit.
2. Mean of raw and ungrouped frequency data
For values with frequencies:
mean = sum of (value × frequency) ÷ sum of frequencies
Use a product column and check the total frequency. The mean need not be an observed value. It retains units and may be impossible as an individual outcome, such as 2.4 siblings, while still describing the group.
Reverse problems use total = mean × number of observations. If one value is missing, reconstruct the required total and subtract the known values. If two groups are combined, add their totals and frequencies before dividing. Do not average their means unless their group sizes are equal.
3. Median and mode of exact data
Order raw data before finding the median. For odd sample size, use the single middle item. For even sample size, average the two middle numerical values. In an ungrouped frequency table, use cumulative positions to locate these observations without rewriting every value.
The mode is the value with greatest frequency. There can be no mode, one mode or more than one mode. For categorical data, mode may be the only meaningful measure of centre.
The median uses position rather than magnitude. An extreme value can greatly alter the mean but may leave the median unchanged.
4. Estimated mean for grouped data
Exact values inside each class are unknown, so represent every class by its midpoint:
estimated mean = sum of (class midpoint × frequency) ÷ total frequency
Create columns for boundaries, midpoint, frequency and midpoint-frequency product. The answer is an estimate because observations are unlikely to sit exactly at every midpoint. Sensible precision should reflect the original measurement and grouping.
5. Estimated median by cumulative frequency
The median position is halfway through the ordered data. On a cumulative frequency graph, locate half the total frequency on the vertical axis, move horizontally to the curve and then down to the variable axis.
Check this topic from memory
Attempt the matching topic bank before reopening the notes. Use each missed idea to decide what to review next.
Start the topic quiz