

Cambridge IGCSE Statistics 5: Quartiles, percentiles and measures of dispersion
Cambridge IGCSE Statistics 0479 notes on quartiles, percentiles and measures of dispersion.
Cambridge IGCSE Statistics 0479 Topic 5 covers quartiles and percentiles, range and interquartile range, standard deviation for exact and grouped data, and justified selection of a dispersion measure. Dispersion describes how far observations vary, so it must be interpreted alongside a measure of centre.
Q: Does a smaller IQR mean more consistent data?
A: For comparable datasets, a smaller IQR means the middle 50% of the values is less spread out. Quartiles are measures of position; the IQR calculated from them is a measure of dispersion.
1. Quartiles in exact data
Order the observations first. The lower quartile, Q1, marks approximately the 25th percentile; the median, Q2, marks the 50th; and the upper quartile, Q3, marks the 75th. Follow the positional convention stated in the question or used consistently by the course, because conventions can differ for small samples.
In an ungrouped frequency table, cumulative frequencies locate quartile positions without listing every repeated value. Always check the total frequency before selecting positions.
Quartiles divide ordered positions, not the numerical scale, into four parts. Q1 is not one quarter of the largest value.
2. Percentiles and cumulative frequency
The pth percentile is the value below which approximately p% of observations lie. On a cumulative frequency graph with total N, locate p ÷ 100 × N on the cumulative-frequency axis, move to the curve, then read the corresponding data value.
To estimate the percentile rank of a given value, read its cumulative frequency and calculate cumulative frequency ÷ N × 100. To estimate the number in an interval, subtract the cumulative readings at its endpoints. Above a value equals total frequency minus the cumulative frequency below it.
Graph readings are estimates and should reflect plotting accuracy. Do not report implausible precision.
3. Linear interpolation for grouped percentiles
Locate the class containing the target cumulative position. Then use:
estimate = lower boundary + (position into class ÷ class frequency) × class width
Position into class equals target cumulative position minus cumulative frequency before the class. This method assumes observations are spread approximately evenly within the class. It is more systematic than guessing from a graph but remains an estimate because the raw positions are unknown.
The same method can estimate Q1, the median, Q3 or any requested percentile.
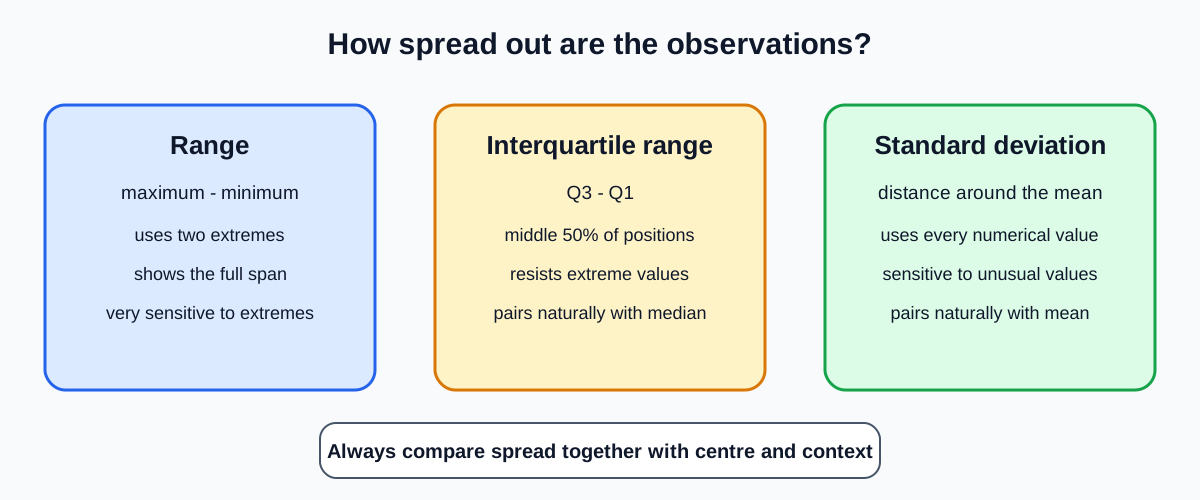
4. Range and interquartile range
range = maximum - minimum
Check this topic from memory
Attempt the matching topic bank before reopening the notes. Use each missed idea to decide what to review next.
Start the topic quiz