

Cambridge IGCSE Statistics 9: Crude and standardised rates
Cambridge IGCSE Statistics 0479 notes on crude and standardised rates.
Cambridge IGCSE Statistics 0479 Topic 9 covers crude rates, the reason for standardisation, standardised rates using a reference population, comparisons, and reverse calculations from rates to event totals. Rates may describe births, deaths, accidents or other events.
1. Crude rates
A crude rate compares the total number of events with the entire population during a stated period:
crude rate per k = number of events ÷ population × k
The scale k may be 100, 1000, 100 000 or another stated amount. Include both scale and time, such as deaths per 1000 people per year. A bare decimal is incomplete because readers cannot tell what it represents.
Crude rates allow populations of different sizes to be compared proportionally. They summarise the whole population in one number, but conceal differences among subgroups.
2. Recovering event totals
Rearrange the rate relationship:
events = rate ÷ k × population
For a subgroup, use that subgroup's rate and population. The result represents a count, so context may require a whole number. Keep the unrounded value until all subgroup estimates are added, then use sensible rounding instructions.
Population can likewise be recovered as events multiplied by k and divided by rate, provided the rate is non-zero.
3. Why crude comparisons can mislead
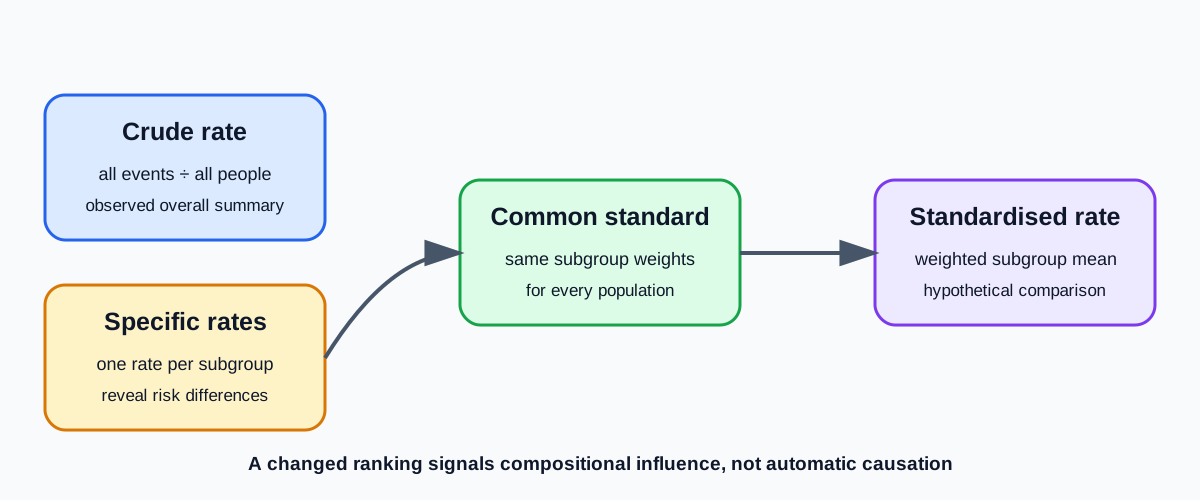
Event risk often differs across age, sex, occupation or another classification. Two populations can have identical subgroup-specific rates but different crude rates simply because their subgroup compositions differ.
For example, a population with a greater proportion of older residents may have a higher crude death rate even when every age-specific rate matches a younger population. The crude difference then reflects composition, not necessarily worse subgroup outcomes.
Standardisation controls a specified compositional factor by applying each population's subgroup rates to the same reference distribution.
4. Direct standardisation
For each subgroup:
- take the population's subgroup-specific rate
- apply it to the matching subgroup size or weight in the standard population
- calculate the expected events or weighted contribution
- add across subgroups
- divide by the total standard population, using the requested rate scale
Equivalently, the standardised rate is a weighted mean of subgroup rates, with weights from the standard population.
Weights must correspond to the same subgroup in every row. If weights are proportions, they should sum to 1; if they are counts, divide by their total.
Check this topic from memory
Attempt the matching topic bank before reopening the notes. Use each missed idea to decide what to review next.
Start the topic quiz