

Cambridge IGCSE Statistics 11: Bivariate distributions
Cambridge IGCSE Statistics 0479 notes on bivariate distributions.
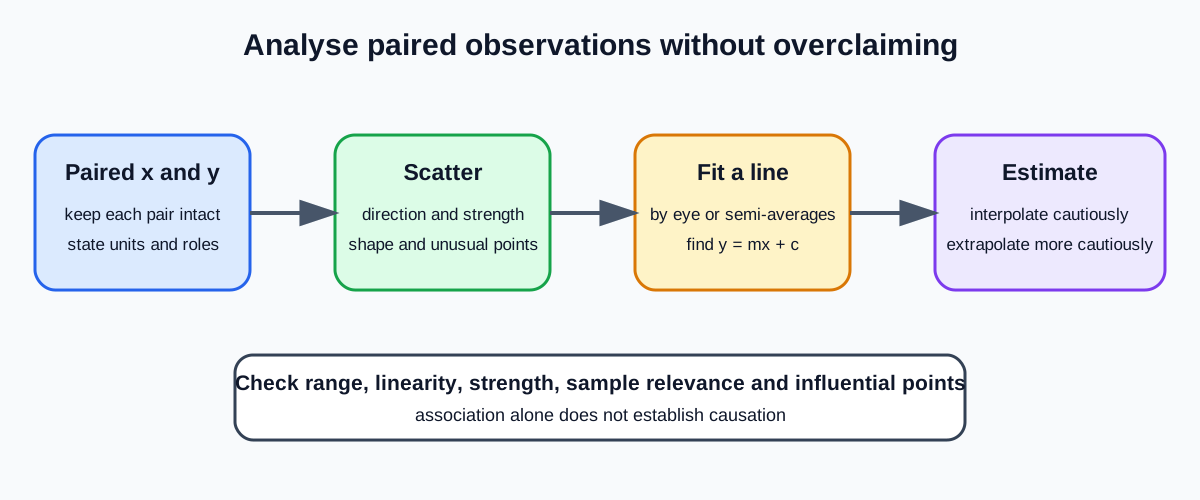
Cambridge IGCSE Statistics 0479 Topic 11 covers independent and dependent variables, correlation, scatter diagrams, lines of best fit by eye and semi-averages, linear equations, estimation, and the assumptions and limitations of those estimates.
1. Paired variables
Bivariate data record two variables for each observational unit. Every x-value must remain paired with its corresponding y-value. Sorting the two columns separately destroys the relationship.
The independent variable is used to explain or predict and is conventionally placed on the horizontal axis. The dependent variable is the response and appears vertically. In observational studies, these labels describe modelling roles and do not prove that x causes y.
State variables with units. “Time studied in hours” and “test score in marks” are clearer than x and y alone.
2. Scatter diagrams
Plot each pair as one point. Choose linear scales covering the data, label both axes and do not join successive points. A scatter diagram reveals direction, strength, form, clusters and unusual observations.
Use most of the plotting region without distorting either scale. Check coordinates systematically against the source table.
3. Describing correlation
Positive correlation means larger x-values tend to accompany larger y-values. Negative correlation means larger x-values tend to accompany smaller y-values. No correlation means there is no clear directional pattern.
Strength describes how tightly points follow a trend: strong patterns cluster closely, while weak patterns are diffuse. Use combined language such as “strong negative correlation”.
Correlation concerns association, not causation. A lurking variable may influence both measures, the direction of influence may be reversed, or the pattern may be coincidental.
4. Drawing a line by eye
A line of best fit should follow the central linear trend, with a reasonable balance of points above and below. It need not pass through the origin or any observed point. Ignore neither unusual points nor the main cluster; judge whether an extreme point is representative before allowing it to dominate.
Choose two well-separated points on the drawn line, not necessarily data points, to calculate its gradient. Read their coordinates carefully from the graph scale.
5. Method of semi-averages
Cambridge specifies an even number of data pairs for this method. Order pairs by x, split them into two equal groups, and calculate the mean x and mean y within each half. This gives two mean points.
Draw the line through those mean points. Its equation has form
Check this topic from memory
Attempt the matching topic bank before reopening the notes. Use each missed idea to decide what to review next.
Start the topic quiz