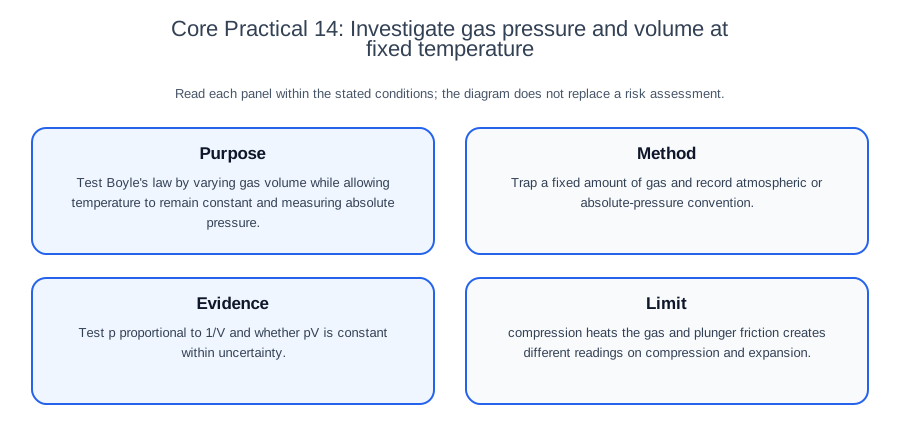
This outline tests pressure and volume for a fixed gas sample under controlled temperature conditions. It supports development of a locally approved method and pressure/mechanical risk assessment; it is not a complete validated procedure. Check current Pearson documents for course-specific requirements.
Aim and scientific principle
Test the inverse relationship between absolute pressure and the total volume occupied by a fixed amount of gas at approximately constant temperature, over a stated range in which the ideal-gas approximation is appropriate. A sealed label,stable display or straight graph alone does not establish all those conditions.
Begin by translating the title into a testable question. Identify what is deliberately changed, what is measured directly, what is calculated and what must remain controlled. Predict a relationship only after naming the mechanism. A prediction without a reason is weak; a reason without measurable variables cannot guide a practical design.
Apparatus and setup
Use a pressure-rated gas syringe or Boyle's-law apparatus, suitable pressure sensor, volume scale, secure support and temperature monitoring or a justified equilibration method. Identify whether the sensor measures absolute pressure or pressure relative to a reference. Include connecting tubing, fittings and sensor cavities in the trapped-volume assessment; the syringe scale need not show the whole gas volume. Consider measuring range, resolution, uncertainty, calibration and suitability for the sample, not the instrument name alone. Draw a labelled scientific setup that shows the working geometry and exactly where readings are taken. Include a control or blank when it distinguishes the target effect from drift, contamination or background response.
Before collecting results, check zero readings, calibration, leaks, alignment or sterility as relevant. Record the instrument resolution beside the first raw-data table. If a digital device displays more digits than its underlying accuracy supports, do not treat every digit as equally certain.
Method
Trap a fixed gas sample without exceeding the approved pressure/volume limits. Record the pressure reference and calibration. For an atmosphere-referenced gauge, measure or justify the atmospheric pressure used for conversion; do not add it again to an absolute-pressure reading. Determine or bound unmarked connecting volume.
Change volume in safe increments, secure the setting and allow thermal re-equilibration. Monitor pressure/temperature drift with a justified waiting criterion. Slow motion alone does not prove isothermal conditions, and room temperature need not immediately equal the gas temperature.
Check this topic from memory
Attempt the matching topic bank before reopening the notes. Use each missed idea to decide what to review next.
Record paired pressure,total-volume and relevant temperature/time readings. Revisit settings during compression and expansion, and hold selected volumes to check drift. A changing pressure may reflect temperature relaxation,leakage,creep or sensor drift; it does not identify a leak by itself. Do not automatically average directional disagreement.
Analyse absolute pressure against reciprocal total volume and/or the pressure-volume product with uncertainty. Check residuals and the consequences of pressure/volume offsets. Do not force an origin or fit an unknown dead volume solely to obtain agreement and then call that an independent test.
Plan the analysis before starting. This reveals whether an additional measurement is needed for a derived quantity and prevents a completed experiment from lacking a mass, length, concentration, background or calibration value. A method should be detailed enough for another trained student to reproduce, while avoiding decorative steps that do not affect validity.
Variables and controls
Independent variable: gas volume.
Dependent variable: absolute pressure.
Important controls: amount and composition of gas,temperature,leak tightness,true volume setting,tubing/sensor geometry and pressure reference. Keep orientation and settling procedure consistent where relevant; document how stability is assessed rather than assuming a fixed waiting time guarantees equilibrium.
For each control, state how it is maintained or monitored. Simply writing "keep temperature constant" is incomplete if the method has no bath, probe, equilibration time or other means of doing so. Choose a range wide enough to reveal the relationship but within safe and scientifically valid limits. Choose the number, range and spacing of values for the expected response and analysis. Concentrating values near an uncertain threshold or optimum can be more useful than uniform spacing; no fixed count establishes an adequate design.
What is distinctive about this practical
For a suitable ideal-gas approximation, pabsVtot=nRT. Fixed gas amount and thermodynamic temperature imply a constant product. A gauge referenced to local atmosphere gives pabs=pg+patm; an absolute sensor must not receive that addition. Another differential-pressure reference needs its own stated conversion.
If an effectively rigid,constant unmarked volume shares the same pressure and temperature, Vtot=Vs+Vd, where the syringe scale gives Vs and tubing/sensor cavities contribute Vd. Check rather than assume that this volume is constant and at the same temperature. Flexible tubing,nonuniform temperature or a changing gas amount can invalidate the simple correction.
For fixed n and T, absolute pressure against reciprocal total volume should be a straight line with slope nRT and a zero intercept within relevant uncertainty. Gauge pressure on the same reciprocal-volume axis can instead have a negative atmospheric-pressure intercept; that is not by itself a failure of Boyle's law. Ignoring dead volume can produce curvature against reciprocal indicated volume. Neither a straight line nor an offset uniquely identifies the error mechanism.
Plunger friction affects motion,positioning and pressure inferred from an external force balance. It does not by itself imply two equilibrium gas pressures at identical true gas amount,temperature and volume when pressure is sensed directly. Investigate thermal lag,volume positioning/compliance,leaks and sensor response before attributing compression/expansion differences to friction.
Recording and processing results
Use absolute pressure and total trapped volume with consistent units. Retain raw sensor readings,reference pressure,indicated volume,dead-volume estimate,temperature/time evidence and directional repeats. Test whether the corrected product is constant within uncertainty and inspect residuals. Pressure against reciprocal total volume has slope nRT in the stated model; reversed axes have reciprocal slope. Do not interpret a gauge-pressure intercept or uncorrected volume offset as a new gas law. Include common calibration and reference uncertainties and the increased relative importance of a fixed volume uncertainty at small volumes. Put units in column headings,record raw readings consistently with instrument resolution and the method,and distinguish repeats from calculated means. Do not delete anomalies simply to improve the fit; investigate and document any exclusion.
Choose a fitted line, curve or ruled joins according to the data, scientific relationship and question; do not connect or smooth points mechanically. A gradient should use a large triangle and values read from the fitted line. When a relationship is linearised, explain the transformation and connect gradient or intercept to the requested physical quantity. When observations are categorical, define the category rule before seeing the result.
Safety, ethics and responsible practice
Do not exceed apparatus pressure limits, secure the syringe and use eye protection. A useful safety statement names the hazard, identifies who or what could be harmed and gives a control that reduces likelihood or severity. "Take care" does not specify an action that reduces the identified risk.
Worked application: from raw evidence to a defensible conclusion
This is a constructed ideal-gas check,not experimental data or an approved pressure setting. Suppose a fixed sample at one temperature occupies 20 mL indicated volume plus 5 mL unmarked volume at 100 kPa absolute pressure. At 10 mL indicated volume with the same 5 mL correction,the ideal model predicts about 166.7 kPa absolute,not 200 kPa. If local atmospheric pressure is taken as 100 kPa for this constructed example,the corresponding gauge readings are 0 and about 66.7 kPa.
The corrected absolute-pressure products agree by construction. The indicated-volume products and gauge-pressure products do not. These numbers illustrate why the pressure reference and total volume matter; they do not establish real dead volume,isothermal behaviour,leak tightness or instrument accuracy. Retain evidence for those conditions independently of agreement with the model.
This chain is stronger than a memorised recipe because every step answers the practical question. If the graph contradicts the prediction, report the evidence honestly and investigate method, range, controls and model assumptions before claiming a new scientific law.
Evaluation: limitation, effect and improvement
Limitation: temperature changes during compression/expansion,unmarked or changing volume,leaks and pressure-reference errors can distort the comparison. Plunger friction can hinder positioning or invalidate a pressure inferred from applied force if its force is omitted.
Likely effect: rapid compression can leave the gas warmer and pressure above its re-equilibrated value; expansion can cool it. A gauge/absolute mismatch changes the pressure offset,and uncounted connecting volume changes the volume used in the product. Different direct sensor readings at the same indicated volume do not by themselves establish frictional pressure hysteresis at the same true gas state.
Targeted improvement: use pressure-rated apparatus,secure each setting,allow and document re-equilibration,check the pressure reference and bound total trapped volume. Examine hold tests and both directions to distinguish candidate errors. Correct a known effect or report unresolved disagreement; averaging directions is not a general correction for thermal or mechanical bias.
Separate random variation, systematic bias and model limitation. Repeats help reveal random variation but do not remove a zero error. Calibration establishes the relation between reference values and indications; appropriate adjustment or correction can address an identified offset. It does not make biased sampling representative. Finer resolution and greater repeatability are distinct properties, and finer resolution may improve an estimate only when the reading is a material source of uncertainty.
Common misconceptions and corrections
Repeats automatically make a result accurate. Repeats estimate random variation; they do not correct a biased method or calibration error.
A control variable is just a list item. Explain the apparatus or procedure that keeps it stable.
The line must pass through every point. Use the overall pattern and a best-fit relationship, then investigate justified anomalies.
Percentage error and percentage uncertainty are interchangeable. Error compares a measured value with a suitable reference. Uncertainty characterises dispersion of values attributed to the measurand; it may be expressed as a standard uncertainty or an interval with stated coverage, and includes more than resolution alone. State the reference, denominator and uncertainty convention used.
A successful endpoint proves the theory. The observation supports a conclusion only within the method, range and assumptions tested.
More sophisticated apparatus is always better. The improvement must address the dominant limitation and be practical in the stated context.
Assessment guidance
Pearson assesses practical understanding throughout the science papers and concentrates it in written Units 3 and 6. Planning answers need an operational independent variable, a measured dependent variable, a justified range, controls, repeats, safety and a stated analysis. Data answers need units, consistent precision, sensible significant figures and transparent calculations. Graph answers need labelled axes, a scale using the grid well and line treatment appropriate to the data and question. Evaluation answers should use a limitation-effect-improvement chain specific to the apparatus. Do not claim that a memorised core-practical recipe is the only acceptable method when the question supplies a different valid context.
Retrieval practice
Extend or adapt this practical to answer a related question. Where the design uses a continuous variable, justify its planned values. List apparatus with range and resolution where relevant, control methods, a raw record layout, the expected analysis and one hazard-control pair. Then identify one random uncertainty, one systematic bias and one model limitation. Explain which can be reduced by repeats, which needs calibration followed by appropriate correction or adjustment, or a redesign, and how your conclusion would change if the anomaly were confirmed.