

Pearson IGCSE Biology Practical 3: Tables, Graphs and Calculations
Present and analyse Pearson International GCSE Biology practical data using tables, graphs, rates and means.
Biological data become useful only when units, repeats and variation remain visible.
Pearson 4BI1 data questions test whether a biological pattern survives proper processing. A mean without repeats hides variation, a graph with the wrong form distorts the variable type, and a calculation with mismatched units can make a plausible biological conclusion numerically false.
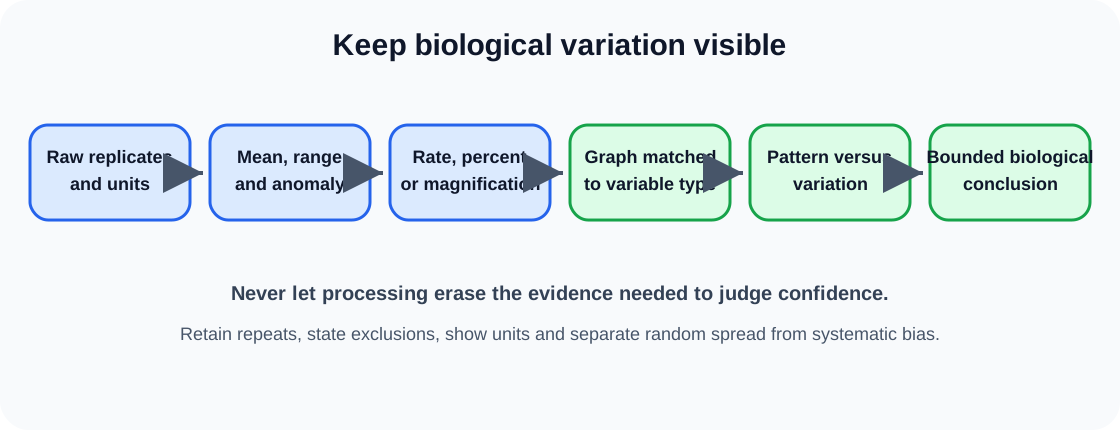
Data workflow
- Put the independent variable in the first column and include units in headings.
- Keep decimal places consistent within each measured column.
- Show repeats before a mean so spread and anomalies can be judged.
- Use a scatter or line graph for continuous variables and bars for separate categories.
- Label axes with quantity and unit, choose a scale using most of the grid, and draw an appropriate trend.
- Calculate rates, percentage changes and magnification with working.
Tables that preserve evidence
Put the independent variable first, followed by raw dependent-variable replicates, mean and any derived quantity. Write each unit in the heading, not every cell. Direct readings from one instrument should use consistent decimal places. Record raw values before rounding calculations so anomalies and spread remain auditable.
Do not replace a non-numerical observation with an invented number. Colour categories can use an agreed ordinal scale only when the scale is defined. Presence and absence data, counts, percentage cover and continuous sensor readings represent different evidence and should not be mixed without explanation.
Means, spread and anomalies
Calculate a mean by summing valid replicates and dividing by their number. A mean estimates the central response but does not show biological variability. Range, minimum and maximum, or plotted error bars can show spread. Two treatments with different means but heavily overlapping variation may not be distinguishable by the experiment.
An anomaly is inconsistent with the other repeats or supported trend. Recheck transcription and repeat that condition where possible. Exclude a value only with a stated reason; being far from the prediction is not sufficient. Repeats reduce random variation in a mean but do not correct a miscalibrated sensor, contaminated solution or biased sample.
Choosing a graph
Use a line graph or scatter graph when the independent variable is continuous, such as temperature, concentration or distance. Plot each point accurately and draw a smooth curve or best-fit line appropriate to the biology. Do not join points mechanically when they are estimates with scatter.
Check this topic from memory
Attempt the matching topic bank before reopening the notes. Use each missed idea to decide what to review next.
Start the topic quiz