

Pearson IGCSE Chemistry Practical 3: Tables, Graphs and Calculations
Present and analyse Pearson International GCSE Chemistry data using tables, graphs, gradients and calculations.
Chemical data should preserve units and raw readings before being converted into rates, amounts or energy changes.
Good presentation keeps the evidence auditable. A reader should be able to recover what was measured, distinguish raw from processed data and check how a conclusion follows from the table, graph or calculation.
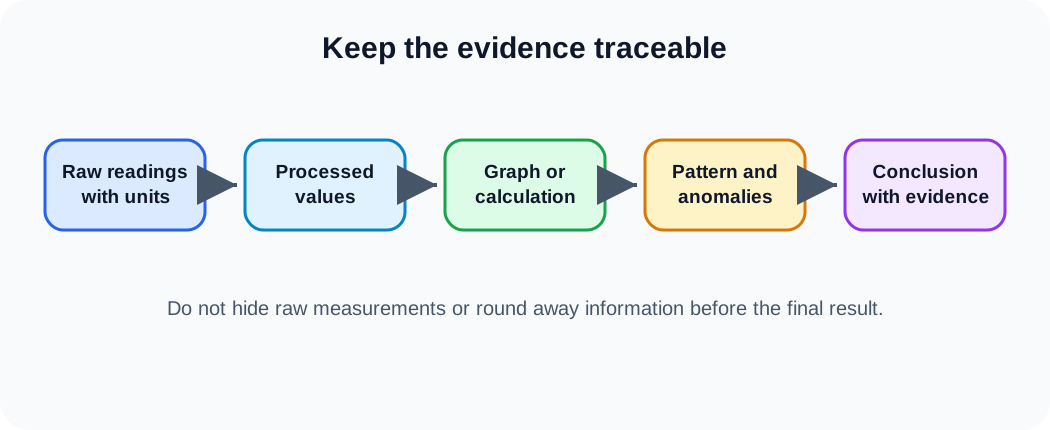
Data workflow
- Put the independent variable first and units only in headings.
- Keep precision consistent with the measuring instrument.
- Plot continuous variables with sensible scales and a best-fit line or curve.
- Calculate a gradient over a large triangle and include gradient units.
- Show balanced equations and mole ratios before quantitative conclusions.
- Retain intermediate precision and round only the final result appropriately.
Build a useful results table
Put the independent variable in the first column and place units in headings, not repeated in every cell. Record raw readings before calculated differences. A titration table therefore shows initial burette reading, final burette reading and titre. A calorimetry table shows initial and final or maximum temperature before temperature change.
Use consistent precision within a measured column because the same instrument was used. A value of 12 among readings such as 14.20 and 16.35 hides the instrument resolution. Calculated columns may use a different justified precision, but should not imply certainty absent from the raw measurements.
Choose and construct a graph
Use a graph for continuous variables such as time, temperature or concentration. Label both axes with quantity and unit, choose a simple scale that uses most of the grid and plot points accurately. A line of best fit represents the overall relationship; it need not pass through every point or the origin. A smooth curve is appropriate when the process changes continuously, such as gas production slowing as reactants are consumed.
An anomalous point lies away from the supported pattern. Do not remove it simply because it is inconvenient. Recheck plotting and raw data, repeat that condition if possible, and exclude it from a mean or fit only with a scientific reason.
Gradients, rates and intercepts
Gradient units come from vertical-axis units divided by horizontal-axis units. Calculate a straight-line gradient with two well-separated points on the best-fit line, not necessarily two experimental points. For a curve, draw a tangent at the requested time and use a large triangle on that tangent.
Check this topic from memory
Attempt the matching topic bank before reopening the notes. Use each missed idea to decide what to review next.
Start the topic quiz