

Pearson IGCSE Physics Practical 3: Tables, Graphs and Calculations
Present and analyse Pearson International GCSE Physics data using tables, graphs, gradients and uncertainties.
Graphs reveal physical relationships when variables, units, scales and uncertainty are handled consistently.
Pearson 4PH1 practical-data questions test a complete chain: organise observations, calculate derived quantities, display the relationship, extract numerical information and judge what the pattern means. A neat graph is not enough if the axes, best fit, gradient or physical interpretation is wrong.
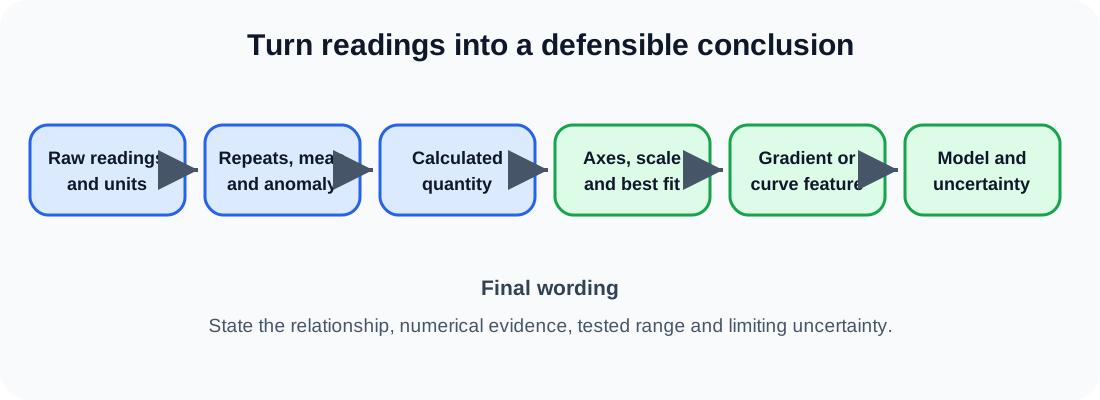
Data workflow
- Place the independent variable first and include every measured and calculated quantity with units.
- Preserve consistent decimal places for direct measurements.
- Plot points accurately using most of the grid and draw an appropriate best-fit line or curve.
- Calculate gradient from a large triangle on the best-fit line, not from neighbouring raw points.
- Interpret intercepts only when the model gives them physical meaning.
- Compare percentage uncertainty with the size of the observed effect.
Construct a useful table
Write each quantity once in the heading with its unit, for example time / s, rather than repeating units in every cell. Put the independent variable first, followed by repeated dependent readings, their mean and any derived quantity. Keep direct readings from the same instrument at consistent decimal places. A mean may retain suitable precision, but it should not imply detail absent from the measurements.
Record raw readings before calculating. This preserves evidence for checking anomalies and arithmetic. If a value is repeated, show all repeats rather than only the chosen mean. Identify an anomaly from its disagreement with the other evidence or trend, not simply because it is inconvenient. Recheck the apparatus or repeat that condition before deciding whether exclusion is justified.
Choose axes and scales
Plot the independent variable horizontally and dependent variable vertically unless a requested transformation makes another arrangement necessary. Label both axes with quantity and unit. Select a simple linear scale that uses most of the available grid and can be read reliably. An axis does not always need to begin at zero, but a break or truncated range must be clear and should not visually exaggerate small changes.
Plot every point with a small precise cross. Error bars may represent the stated uncertainty or spread when requested. Draw one appropriate straight best-fit line or smooth curve that follows the overall pattern, with points reasonably balanced around it. Do not join points dot to dot when scatter is expected around an underlying physical relationship.
Gradient and intercept
Check this topic from memory
Attempt the matching topic bank before reopening the notes. Use each missed idea to decide what to review next.
Start the topic quiz