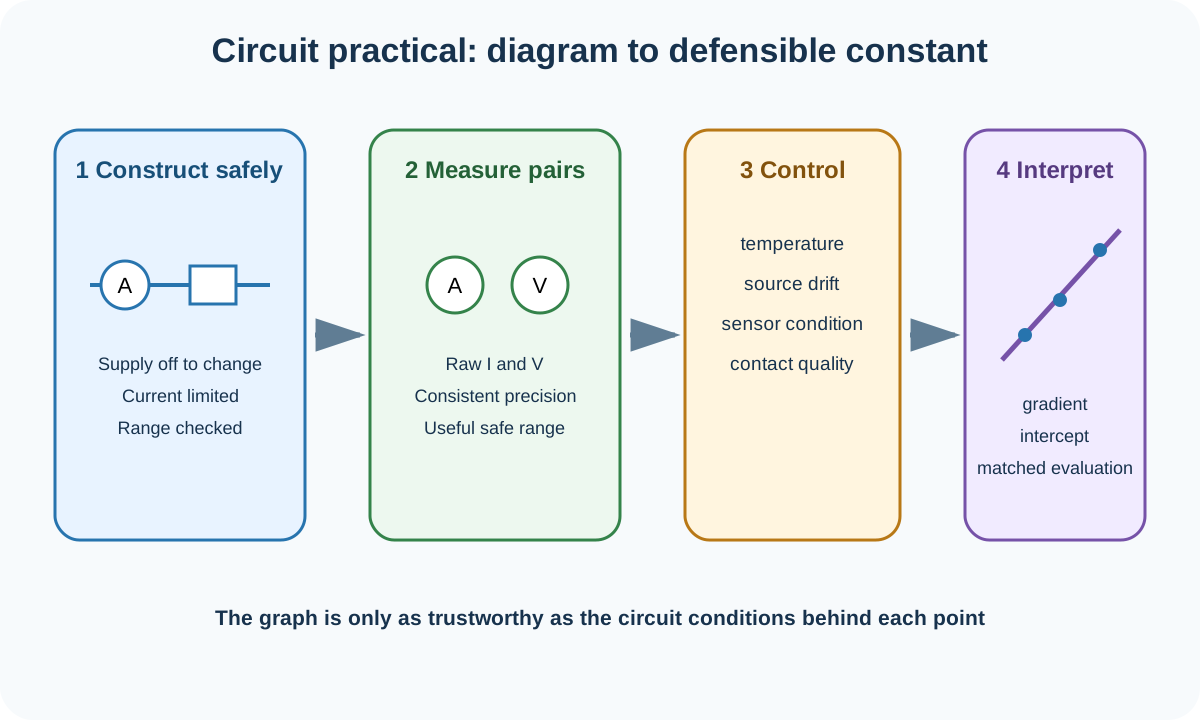
Electricity and circuit experiments are representative settings for the transferable skills assessed in Cambridge International AS and A Level Physics 9702 Papers 3 and 5. Candidates must convert a diagram into a working circuit, measure safely over a useful range, preserve raw meter readings, choose a graph from the supplied model and evaluate limitations that actually affect the electrical evidence.
Official practical boundary
Paper 3 requires candidates to follow written and diagrammatic instructions, including circuit diagrams, and use analogue or digital electrical meters. Paper 5 planning can require a clear labelled circuit, fit-for-purpose instruments, controlled variables, a workable method, derived graph quantities and relevant safety precautions.
Cambridge does not prescribe the investigations below as a fixed practical list. Current-voltage characteristics, dividers and source resistance are useful contexts for practising the official skill contract.
Build and check the circuit
Translate every junction in the circuit diagram before connecting the supply. An ammeter measures current through a branch and is connected in series. A voltmeter measures potential difference between two points and is connected in parallel with the component. Reversing these roles can produce an unusable circuit or excessive current.
Keep the supply switched off while changing connections. Begin with a protective resistance or low supply setting when the likely current is uncertain. Check meter polarity for direct current and choose a range that avoids overload. After confirming a safe reading, select a lower range if it materially improves resolution.
Use short, secure leads and inspect loose contacts. A switch allows readings to be taken briefly, reducing heating and drift. Record the actual meter readings rather than values implied by nominal component labels.
Before collecting a full table, take a trial reading at each end of the intended range. This checks that the circuit works, the meter limits are respected and the dependent variable changes enough to resolve a trend.
Collect current-voltage data
For a component characteristic, vary potential difference with a variable resistor or adjustable supply and measure paired V and I readings. State which quantity is deliberately changed and which responds. Collect values across the largest safe range and include both polarities only if the task and component permit.
For a resistor intended to remain ohmic, limit current so its temperature stays approximately constant. Heating changes resistance and can curve a graph that should test a constant-temperature relationship. Switch off between readings or work promptly, but do not claim that this guarantees an exactly constant temperature.
Check this topic from memory
Attempt the matching topic bank before reopening the notes. Use each missed idea to decide what to review next.
A graph of V against I has gradient resistance for an ohmic component:
R=ΔIΔV.
A graph of I against V has gradient conductance, not resistance. For a nonlinear characteristic, the ratio V/I at one point and the tangent gradient describe different quantities. Follow the question's requested interpretation.
Reverse the supply safely if negative data are required. For a diode, use a series resistor to limit current and respect polarity. Do not infer a zero current simply because it is below the meter's displayed resolution.
Investigate potential dividers
Two series resistors share the supply potential difference. If the output is measured across R2 with a high-resistance voltmeter,
Vout=VinR1+R2R2.
Keep input voltage controlled while varying resistance, sensor condition or slider position. Define the output terminals explicitly. Measuring across the opposite component reverses the response trend.
A connected load changes the effective resistance of the output section and can reduce the measured output. This loading effect is a limitation of the ideal divider model, not random scatter. Use a high-resistance voltmeter or buffer only when realistic within the proposed method.
For an LDR or thermistor investigation, measure the physical control variable rather than describing it vaguely. Keep lamp distance and ambient light controlled when temperature is varied, or keep temperature controlled when illumination is varied. Allow a sensor to reach a stable condition before reading.
Determine internal resistance
For a source with e.m.f. E and internal resistance r,
V=E−Ir.
Vary external load resistance and record terminal potential difference V and current I. A graph of V against I has intercept E and gradient −r. Use a load range that changes current appreciably without overheating the source or exceeding its safe current.
The open-circuit voltmeter reading can estimate e.m.f., but a full V-I graph separates intercept and gradient evidence. The source can change during a long experiment because of heating or discharge. Take readings promptly, open the switch between readings and consider alternating the measurement order if drift is important.
Contact and lead resistance can contribute to the measured circuit behavior. Do not automatically attribute every gradient discrepancy to the source. State which voltage is measured and which resistances are included by that arrangement.
Tables, graphs and uncertainty
Use one table containing raw meter readings and calculated quantities. Headings need quantity and unit, such as I/mA. Record one raw column consistently with the instrument resolution. Repeated readings are valuable when displays fluctuate or contact is variable; they do not correct a consistent meter offset.
Choose graph axes by rearranging the model. Use scales that occupy at least half the grid, plot every point accurately and draw a trend that balances scatter. Calculate gradient using widely separated points on the best-fit line. Determine an off-scale intercept by substituting a point on the line into y=mx+c.
In Paper 5, include absolute uncertainties in table values, error bars where appropriate and a worst acceptable line. Propagate the resulting gradient or intercept uncertainty into the required resistance, e.m.f. or other constant.
Evaluate circuit evidence
Name the affected measurement and mechanism. "The component heats, so its resistance rises during high-current readings" is specific. "Electricity is lost" is not. A fluctuating contact, meter resolution, source drift and sensor response time require different improvements.
Match each change to the cause: clean and secure contacts for intermittent resistance, a series resistor for excessive diode current, a switch for heating, a data logger for rapid sensor changes, or a high-resistance voltmeter for divider loading. A different experiment is not an improvement to the given one.
Worked application: source e.m.f. and internal resistance
Terminal potential difference is plotted against current for a cell. Two widely separated points on the best-fit line are I=0.10,A,V=1.48,V and I=0.70,A,V=1.24,V. The gradient is (1.24−1.48)/(0.70−0.10)=−0.40,V⋅A−1, so r=0.40,Ω. Substitution into V=E−Ir gives E=1.52,V. A steeper acceptable line would produce a larger r, so Paper 5 uncertainty follows from the best and worst gradients. Opening the switch between readings reduces heating and discharge; repeating readings alone would not remove a steady drift in cell e.m.f.
Common misconceptions and corrections
Connecting an ammeter across a supply. Place it in series with the measured branch.
Connecting a voltmeter in series. Connect it across the two relevant points.
Changing connections with the supply on. Isolate the circuit first.
Starting on the most sensitive meter range. Begin safely, then improve resolution.
Treating nominal resistor values as observations. Record the quantities actually measured.
Collecting data before testing the range. Use trial endpoint readings first.
Calling V/I the gradient of every graph. It equals the V-I gradient only for a line through the origin.
Taking resistance from an I-against-V gradient. That gradient is conductance.
Ignoring component heating. Temperature can change the characteristic systematically.
Using a diode without current limitation. Include a suitable series resistor.
Writing zero when current is below display resolution. State the measurement limit honestly.
Leaving divider output terminals undefined. Name the component or points across which V is measured.
Assuming a voltmeter never loads a divider. Finite input resistance can alter the output.
Changing light and temperature together for a sensor. Control the non-investigated condition.
Calling the V-I intercept internal resistance. The intercept is e.m.f.; negative gradient is r.
Forgetting the minus sign in the source graph. Terminal p.d. decreases as current increases.
Using two raw points for a gradient. Choose points on the best-fit line.
Using close gradient points. Span more than half the line.
Repeating measurements to remove meter zero offset. Check and correct the offset separately.
Writing "use digital meters" as a complete improvement. Explain which resolution or loading problem changes.
Ignoring power and heating risk. Limit current and disconnect between readings where appropriate.
Assessment guidance
Draw the circuit with correct junctions, meter placement and polarity before describing the method. State how the independent variable is changed, how paired readings are measured, which conditions are controlled and how a broad safe range is obtained. Preserve raw V and I values, rearrange the model before choosing axes, and identify gradient and intercept with units and signs. Evaluate a named measurement mechanism such as heating, source drift, contact resistance or loading, then propose a realistic matched change. Include current-limiting and switch-off precautions where relevant.
Retrieval practice
Design a current-voltage investigation, a loaded potential-divider test and an internal-resistance method. For each, draw the circuit, define variables and controls, choose meter ranges, specify the data table and derive the graph meaning. Then identify one systematic limitation, one random limitation, a matched improvement and a specific electrical or heating precaution.
Theory and practical ownership
Theory Topics 9 and 10 explain current, potential difference, resistance, characteristics, e.m.f., internal resistance and divider equations. This practical note covers safe construction, measurement range, paired data, graph evidence and circuit-specific evaluation. Practical 1 covers general uncertainty rules, while Practical 6 covers the full cross-context analysis framework.
Cambridge International, AS and A Level Physics 9702 syllabus for examinations in 2025, 2026 and 2027, Practical assessment expectations for Paper 3 Advanced Practical Skills and Paper 5 Planning, Analysis and Evaluation. The named circuit investigations are representative contexts, not a prescribed experiment list.