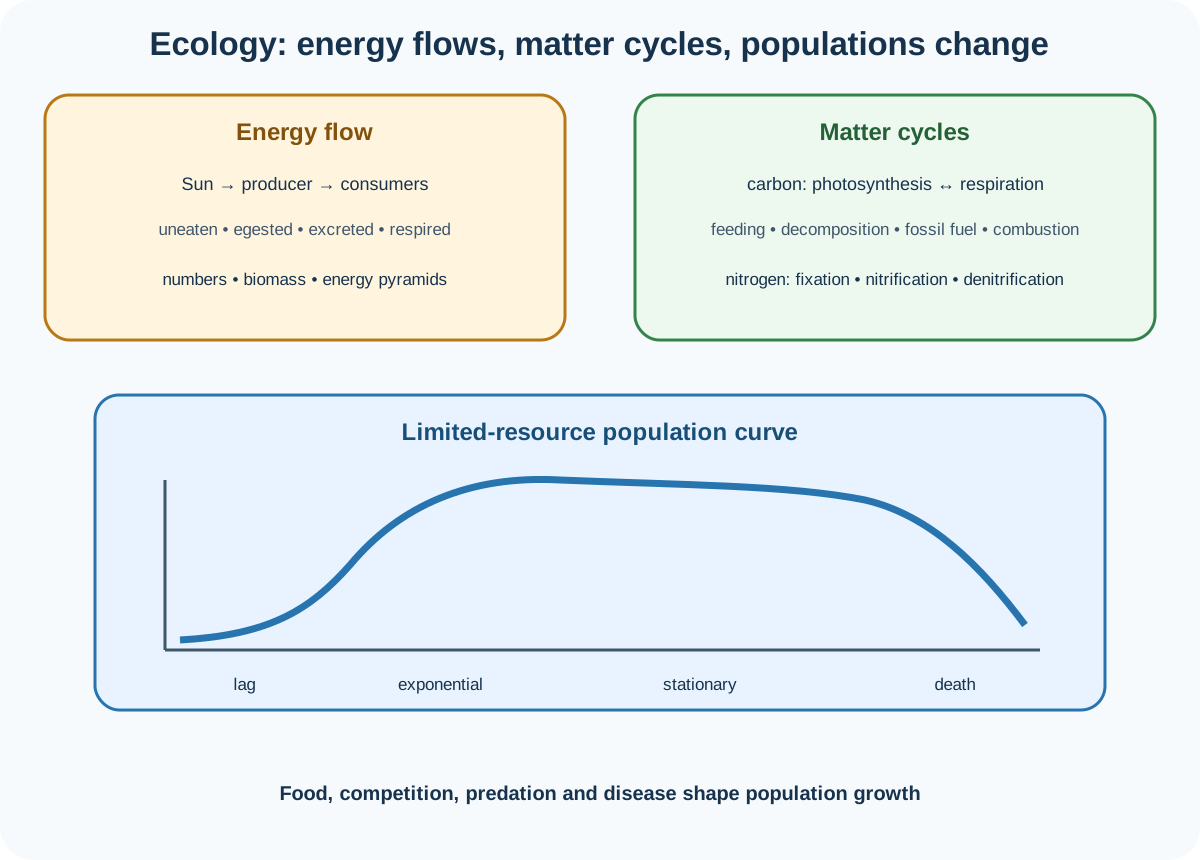
Topic 19 of Cambridge IGCSE Biology 0610 and 0970 follows energy into, through and out of biological systems while matter cycles between organisms and the environment. Official sections 19.1 to 19.4 cover feeding relationships, ecological pyramids, human food-web impacts, carbon and nitrogen cycles and population growth under limiting resources.
Energy enters from the Sun
The Sun is the principal source of energy input to biological systems. Producers absorb light energy and transfer some of it into chemical energy in organic nutrients through photosynthesis.
Chemical energy passes to consumers and decomposers through feeding. At every stage, organisms respire and eventually transfer energy to the environment, mainly as heat.
Energy flows in one direction. It is not recycled to the Sun or rebuilt automatically at the previous trophic level. Matter such as carbon and nitrogen cycles, but usable energy becomes dispersed in the environment.
Food chains and food webs
A food chain shows energy transfer from one organism to the next and begins with a producer. An arrow points in the direction of energy transfer, from the organism eaten toward the organism that feeds.
A producer makes its own organic nutrients, usually using sunlight through photosynthesis. A consumer gets energy by feeding on other organisms.
A herbivore is an animal that obtains energy by eating plants. A carnivore obtains energy by eating other animals. A decomposer obtains energy from dead or waste organic material.
A food web is a network of interconnected food chains. One organism can have several prey, predators or food sources. A change can therefore spread along more than one route.
Trophic levels
A trophic level is an organism's position in a food chain, food web or ecological pyramid.
The producer is the first trophic level. A primary consumer feeds on a producer. A secondary consumer feeds on a primary consumer. Tertiary and quaternary consumers occupy later levels.
An omnivore may occupy different trophic levels depending on what it eats in a particular chain. Trophic level is a feeding position, not a permanent species label in every context.
Human changes to food webs
Overharvesting removes organisms faster than their populations recover. Removing a food species reduces that population directly, can deprive predators of food and can release its prey from predation. The effect depends on all web connections.
Introducing a foreign species can add a predator, competitor, herbivore or pathogen. A foreign species may spread rapidly if local controls are weak, changing native populations and energy routes.
Check this topic from memory
Attempt the matching topic bank before reopening the notes. Use each missed idea to decide what to review next.
Do not predict every population in the same direction. Trace the arrows, identify the direct interaction and then explain indirect effects and possible alternatives.
Pyramids of numbers
A pyramid of numbers represents the number of organisms at each trophic level. Bar width is proportional to count.
It is simple to construct, but it ignores organism size. One large tree can support many insects, so the producer bar may be narrower than the primary-consumer bar. A pyramid of numbers can therefore be inverted or irregular without violating energy flow.
Pyramids of biomass
A pyramid of biomass represents total mass of living material, commonly dry mass, at each trophic level at a stated time or per unit area.
It accounts for organism size and usually gives a more meaningful estimate of stored chemical material than numbers. A tree contributes more biomass than one insect even though both count as one organism.
Biomass is a snapshot. It can be difficult or destructive to measure, and rapid turnover can make a producer standing biomass small even when it supports a larger consumer biomass at that moment.
Pyramids of energy
A pyramid of energy represents energy transferred at each trophic level per unit area per unit time. It includes a time dimension and directly shows energy flow.
It is always upright because less energy is available for transfer at each successive level. Energy data can be difficult and time-consuming to collect, but this pyramid avoids the size problem of numbers and the snapshot problem of biomass.
Include suitable units with area and time, such as kJ per square metre per year, when supplied.
Why energy transfer is inefficient
Not all material at one trophic level is eaten. Some eaten material is not digested and leaves in faeces. Organisms excrete waste. They respire, transferring chemical energy for movement, active transport, growth, maintenance and other processes, with heat eventually transferred to the environment.
Only energy stored in new biomass is available to the next consumer. Transfer efficiency can be calculated as energy transferred to the next level divided by energy available at the previous level, multiplied by 100 percent.
Repeated loss leaves too little energy to support many successive trophic levels, so food chains usually have fewer than five levels.
Humans obtain more available energy by eating crop plants directly than by feeding crops to livestock and then eating the livestock. The livestock uses and loses much of the crop energy before human consumption. This is an energy-efficiency comparison, not a claim that diet is determined by energy alone.
The carbon cycle
Photosynthesis removes carbon dioxide from the atmosphere and incorporates carbon into organic molecules in producers. Feeding transfers carbon through food chains.
Respiration by producers, consumers and decomposers releases carbon dioxide. Decomposition breaks down dead organisms and waste, with decomposers respiring.
Under particular long-term conditions, some dead organic material forms fossil fuels. Combustion of fossil fuels releases carbon dioxide back into the atmosphere.
The cycle must include both biological and long-term geological routes named in the syllabus. Energy released by combustion does not mean the carbon itself disappears.
The nitrogen cycle
Nitrogen gas in the atmosphere is not directly available to most plants. Nitrogen fixation converts it into compounds that can enter biological systems. Fixation occurs through lightning and nitrogen-fixing bacteria.
Plants absorb nitrate ions and use nitrogen to make amino acids and proteins. Feeding transfers plant or animal protein to consumers, and digestion breaks proteins into amino acids.
Decomposition of plant and animal protein produces ammonium ions. Microorganisms perform this decomposition. Nitrifying bacteria convert ammonium compounds toward nitrate ions in nitrification.
Excess amino acids can be deaminated, producing nitrogen-containing waste that returns through waste and decomposition routes.
Denitrifying bacteria convert nitrate compounds back to atmospheric nitrogen, removing available nitrate from soil. The major microorganism roles required are decomposition, nitrification, nitrogen fixation and denitrification. Generic process names are sufficient; names of individual bacterial genera are not required.
Keep nitrogen fixation and nitrification distinct. Fixation begins with atmospheric nitrogen, while nitrification acts on ammonium compounds in soil.
Population, community and ecosystem
A population is a group of organisms of one species living in the same area at the same time.
A community includes all populations of different species in an ecosystem. An ecosystem is a unit containing the community and its environment interacting together.
The definitions are nested: individuals form populations, populations form a community, and the interacting community plus environment forms an ecosystem.
Factors affecting population growth
Cambridge names food supply, competition, predation and disease. These factors affect birth, death, immigration or emigration and therefore population size.
Greater food supply can support survival and reproduction. Competition increases when organisms require the same limited resources. Predation removes prey, while prey availability also affects predator populations. Disease can spread more rapidly at high density and increase death or reduce reproduction.
Do not infer one cause from a curve alone. Use the accompanying conditions or data.
The sigmoid population curve
During the lag phase, population size increases slowly. Individuals may be adjusting to conditions, maturing or reproducing in small numbers.
During the exponential, or log, phase, resources are abundant and limiting factors have relatively little effect. Birth rate exceeds death rate and population increases rapidly.
During the stationary phase, resource limits intensify. Competition, predation, disease or food shortage restrict growth. Birth rate is approximately balanced by death rate, so population fluctuates around a carrying level rather than becoming perfectly motionless.
During the death phase, death rate exceeds birth rate and population falls. Resources may be severely depleted, waste may accumulate or environmental conditions may deteriorate.
Label phases from gradient and trend. A horizontal line is stationary; a steep rising line is exponential; a declining line is death.
Worked application: calculate transfer and explain population change
Grass captures 24 000 kJ per square metre per year, and grazing insects store 2 400 kJ per square metre per year as new biomass. Transfer efficiency is 2 400 divided by 24 000, multiplied by 100, or 10 percent. The remaining energy was not all "lost" in one way: plant material may be uneaten or indigestible, and plants respire. If a foreign predator then reduces the insect population, grass may increase because grazing falls, while native insect-eating birds may decline through reduced food. These outcomes follow the web and need not affect every species equally.
Common misconceptions and corrections
Saying energy is recycled. It flows and is eventually transferred to the environment.
Saying carbon energy returns to the Sun. Carbon cycles; energy does not.
Starting a food chain with a carnivore. It begins with a producer.
Drawing arrows toward the organism eaten. Arrows show energy transfer toward the feeder.
Calling a producer an organism that only produces oxygen. It makes organic nutrients.
Calling every consumer a carnivore. Herbivores and omnivores are consumers too.
Saying decomposers feed only on dead animals. They use dead or waste organic material.
Calling trophic level a fixed species rank. It depends on feeding position.
Predicting food-web effects without tracing links. Direct and indirect interactions matter.
Saying overharvesting affects only the harvested species. Predators, prey and competitors can change.
Assuming every foreign species becomes invasive. Explain the particular interaction and evidence.
Saying pyramids of numbers measure organism mass. They count individuals.
Saying a numbers pyramid must be upright. A large producer can support many consumers.
Saying biomass ignores organism size. It incorporates mass.
Using wet mass without recognising variable water content. Dry mass is more comparable.
Saying biomass always measures transfer over time. It is usually a standing snapshot.
Saying energy pyramids can be inverted. Energy available decreases at successive levels.
Omitting area and time from energy-pyramid units. Both belong to flow rate.
Saying all biomass is eaten. Some remains unavailable to the next level.
Saying all eaten material is absorbed. Some is egested.
Saying respiration destroys energy. Energy is transferred and dispersed, largely as heat.
Adding rather than dividing to calculate efficiency. Use next-level energy over previous-level energy.
Saying food chains are short because predators dislike variety. Repeated energy loss limits later levels.
Saying livestock create extra energy. They use and transfer crop energy before humans eat them.
Saying photosynthesis releases carbon dioxide in the carbon cycle. It removes carbon dioxide.
Omitting respiration by plants. Producers respire too.
Saying decomposition stores all carbon permanently. Decomposers respire, while only some material forms fossil fuels.
Saying combustion removes carbon from the cycle. It releases carbon dioxide.
Saying plants absorb atmospheric nitrogen gas directly. They absorb nitrate ions.
Saying decomposition of protein directly makes atmospheric nitrogen. It produces ammonium ions.
Omitting microorganisms from nitrogen cycling. They perform four required processes.
Giving bacterial genus names as compulsory. Generic process roles are sufficient.
Calling one species in one area a community. It is a population.
Calling all organisms without environment an ecosystem. That is the community component.
Saying food is the only growth factor. Competition, predation and disease are also named.
Calling every early slow increase stationary. It may be lag.
Saying exponential growth continues indefinitely. Limited resources eventually constrain it.
Saying stationary phase has no births or deaths. Rates are approximately balanced.
Omitting the death phase. Population can decline when deaths exceed births.
Claiming a graph alone proves the limiting factor. Supporting condition evidence is needed.
Assessment guidance
Use arrows strictly for energy direction and classify organisms by their actual position in the given chain. Compare pyramids through what each measures, whether it includes organism size and time, and whether inversion is possible. Energy-loss answers need uneaten material, egestion, excretion and respiration rather than a vague statement that energy disappears. Keep carbon and nitrogen as matter cycles and distinguish nitrogen fixation, nitrification and denitrification by starting and final substances. For population questions, give the exact population, community and ecosystem definitions, identify curve phases from gradient and explain them through food, competition, predation, disease and the balance between births and deaths.
Retrieval practice
Construct and analyse two food webs, classify every trophic level and draw matched number, biomass and energy pyramids. Calculate five transfer efficiencies, rebuild both nutrient cycles from blank diagrams and explain each microorganism role. Finally, annotate lag, exponential, stationary and death phases and predict how one named limiting factor changes each phase.
Theory and practical ownership
This theory note owns energy-transfer logic, ecological definitions, pyramid interpretation, nutrient-cycle mechanisms and population-curve explanation. The separate Biology practical hub owns quadrat and transect sampling, randomisation, abundance estimates, environmental measurements, representative samples, tables, graphs, field safety and evaluation.