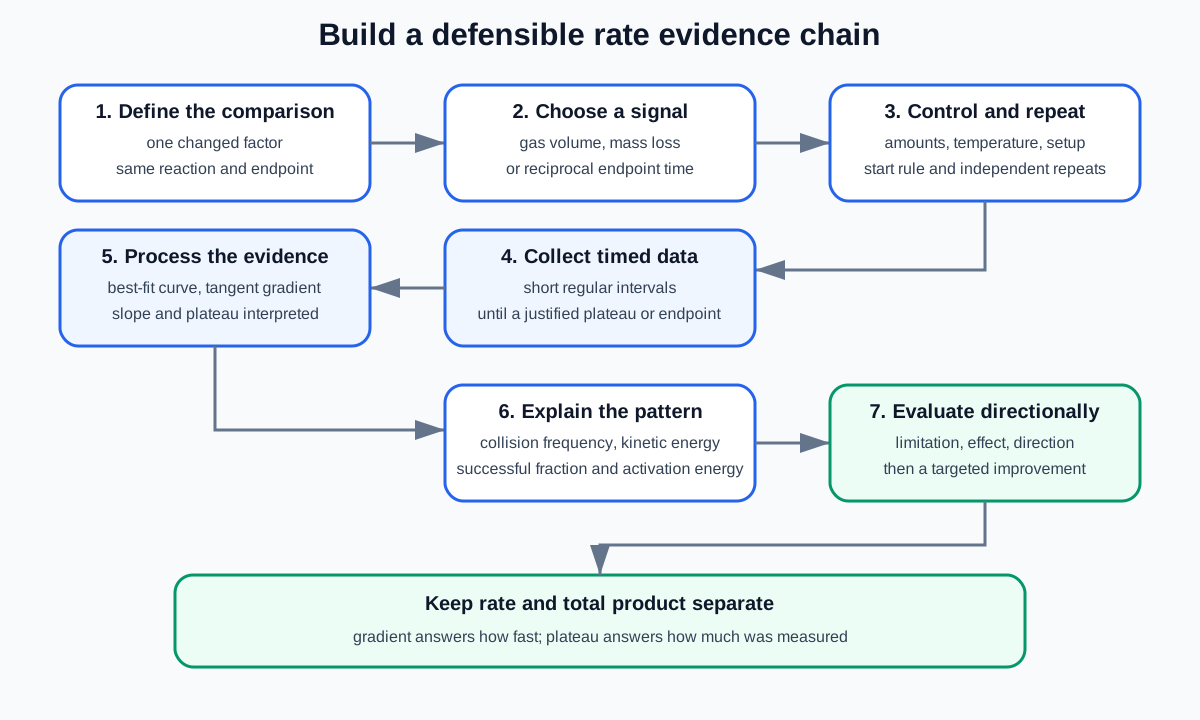
Practical Skill 7 develops Cambridge IGCSE Chemistry section 6.2 through controlled rate investigations. The official focus includes changing concentration, gas pressure, solid surface area, temperature and catalyst condition; measuring mass change or gas formation; interpreting data and graphs; and evaluating the method. Collision theory explains the pattern, but the experiment must first produce defensible evidence.
Define what rate means operationally
Reaction rate is the change in amount of reactant used or product formed per unit time. In a practical, replace “amount” with the quantity actually measured:
gas volume produced per second
mass lost per second
change in concentration per second when data permit
reciprocal time to a fixed visible endpoint
The first three can follow progress throughout a reaction. Reciprocal time gives a comparative rate only when every run uses the same chemical endpoint.
Never compare raw endpoint times as if a longer time meant faster reaction. For the same endpoint, shorter time means faster reaction, while reciprocal time increases with rate.
Choose a signal that matches the reaction
Gas-volume method
Use a gas syringe when the reaction produces a gas that can be contained safely. Connect the reaction vessel to the syringe with an airtight delivery path. Mix the reagents, seal through a reproducible starting step and record gas volume at fixed time intervals.
This method directly measures gas collected and keeps the reaction enclosed. It can fail if gas escapes before the bung is fitted, leaks through joints, dissolves substantially in the mixture or pushes the syringe plunger beyond its safe range.
Check that the syringe moves freely and begins at a known reading. Secure it so plunger motion does not overturn the apparatus. The system must allow the syringe to expand; never block gas production in a sealed fixed-volume vessel.
Mass-loss method
Place the reaction vessel on a balance and allow gaseous product to escape, often through a loose cotton-wool plug that reduces spray without sealing the flask. Record total mass at fixed time intervals.
Mass decreases because gas leaves the apparatus. The method is simple and produces continuous data, but it is unsuitable if the mass change is too small for the balance resolution or if evaporation and spray also remove mass.
Do not fit an airtight bung: trapped gas prevents the intended mass loss and may increase pressure.
Check this topic from memory
Attempt the matching topic bank before reopening the notes. Use each missed idea to decide what to review next.
A disappearing-cross method can compare the time for a mixture to reach the same opacity. View the same cross through the same depth of solution, use the same observer or an objective light sensor where available and stop timing at the defined endpoint.
The method is fast but subjective. It does not measure the complete reaction and must not be compared across different endpoint definitions, vessel diameters or liquid depths.
Other colour or precipitate endpoints may be supplied in an unfamiliar context. The same rule applies: define one reproducible threshold.
Plan one independent variable
Choose a useful range with enough values to reveal a trend. Include units and a practical method for setting each value.
Concentration: prepare specified concentrations or dilute a stock solution while controlling total volume where required. Changing concentration by adding water can also change reactant volume, so state the intended design clearly.
Temperature: equilibrate reactants separately in a controlled water bath, verify temperature, then mix. Temperature can drift after removal, so begin promptly and measure actual reaction temperature if possible.
Surface area: use the same mass and substance but different, consistently classified particle sizes. Powder gives greater total surface area than equal-mass large chips.
Catalyst: compare absent and present conditions or vary a measured catalyst amount while keeping catalyst identity and reactants constant. Recovering unchanged mass at the end is not normally the rate measurement itself.
Gas pressure: use provided data or safe specialised apparatus. Do not improvise a pressurised school setup.
Control the comparison
Control every other factor capable of changing collision frequency or energy:
identity, amount and concentration of non-varied reactants
total liquid volume and reaction-vessel dimensions
temperature unless it is the independent variable
solid mass and particle-size category unless varied
catalyst identity and amount unless varied
mixing procedure and delay before the first reading
gas-collection apparatus and initial syringe position
endpoint rule, observer, viewing geometry and lighting
Operationalise each control. “Keep volume constant” is weaker than “make every mixture to 50.0 cm3 using the same measuring cylinder.”
Use a control condition without catalyst when evaluating catalyst effect. It provides a baseline rather than a repeated trial.
Start timing reproducibly
The earliest part of a reaction is often the fastest, so inconsistent setup delay strongly affects initial rate.
Prepare apparatus before mixing. Use the same trigger in every run, such as adding the final reagent and starting the timer immediately. If a bung must be fitted, use the same trained sequence and acknowledge unavoidable gas loss before sealing.
A divided flask or dropping arrangement may reduce start delay if supplied, but do not invent apparatus beyond the question's resources. Video recording can support later timing of a visible event, though it does not remove chemical or setup errors.
Record a complete time series
Use a table whose headings contain quantity and unit. Record time from zero and take readings at regular short intervals while the curve is steep. Continue until readings become constant or the stated endpoint is reached.
Preserve instrument precision. A gas syringe read to the nearest 1 cm3 should not generate invented decimal places. Record balance readings consistently with its display.
Repeat each condition independently, identify anomalies from evidence and calculate a mean from concordant results. Do not delete a point solely because it weakens the expected trend.
For an endpoint investigation, record all repeat times before calculating mean time and reciprocal time. Average the times first unless the question specifies another processing route.
Plot and interpret rate graphs
Place time on the horizontal axis and the measured progress quantity on the vertical axis. Choose simple scales that use more than half the available grid, label units and draw a smooth best-fit curve rather than dot-to-dot segments when the process is continuous.
For gas volume, a steeper positive gradient means faster product formation. For mass loss, a steeper negative gradient means faster gas escape; compare gradient magnitude when discussing rate.
Initial rate is the gradient of a tangent at time zero or at the earliest justified point. Use a large tangent triangle, calculate change in vertical quantity divided by change in time and include compound units.
Average rate over an interval uses the chord between two stated points. It is not automatically the same as initial rate.
The plateau represents no further measurable change, not necessarily zero remaining reactant. Similar plateaus with different initial slopes indicate similar total measured product but different rates. Different plateaus can mean different limiting amounts, loss, solubility effects or incomplete collection.
Explain patterns with collision theory
Higher concentration or gas pressure puts more reacting particles in a unit volume, increasing collision frequency.
Greater solid surface area exposes more reactant particles, so collisions with the other reactant occur more frequently.
Higher temperature increases particle kinetic energy. Collisions occur more frequently, and a larger fraction of collisions has energy equal to or above the activation energy.
A catalyst provides an alternative pathway with lower activation energy, increasing the fraction of successful collisions. It is unchanged at the end and does not change the final amount produced when starting amounts and limiting reactant remain the same.
Tie each explanation to the observed graph. “Particles move faster” alone does not fully explain a temperature effect.
Separate speed from final amount
Changing concentration by dilution can change both rate and total moles unless total reactant amount is controlled. If fewer moles of a gas-producing reactant are present, the curve may rise more slowly and finish at a lower plateau.
Changing particle size at constant solid mass should alter rate but not theoretical final amount. Adding a catalyst should alter rate but not equilibrium yield or stoichiometric maximum in the same reaction.
Before interpreting a plateau, calculate or identify the limiting reactant from the supplied quantities.
Evaluate by direction of effect
Gas escaping before sealing makes early gas-volume readings too low and usually underestimates initial rate. Assemble first, use a reproducible mixing trigger or use mass loss if suitable.
Leaks reduce recorded gas volume throughout the run. Test apparatus integrity before adding reagents and secure sound joints.
Evaporation during mass loss makes mass decrease for a second reason, so apparent rate can be too high. Use a loose cotton-wool plug and control temperature.
Irregular chip sizes make surface area poorly controlled. Sieve into stated size ranges or use standardised pieces rather than merely repeating.
Temperature drift changes rate during the run. Equilibrate reagents and vessel in a water bath and monitor temperature.
Human judgement varies at a visual endpoint. Use one defined observer and geometry, or an instrumented light threshold if available.
Safety
Wear eye protection and use the specified dilute quantities. Keep gas-generating delivery paths free and never clamp a syringe plunger. Secure apparatus, point moving plungers away from faces and stop before capacity is exceeded.
Use a thermostatically controlled water bath for elevated temperatures rather than a naked flame near flammable materials. Name reagent-specific hazards from the supplied information and match each with a control. Do not smell an unknown gas directly.
Worked application: compare two gas-volume curves
Experiment A produces 48 cm3 of gas in 60 s and reaches 60 cm3 at its plateau. Experiment B produces 30 cm3 in 60 s but also reaches 60 cm3 later. A has the greater initial and early average rate because its curve is steeper, while the equal plateaus support the same total collected product. This pattern is consistent with a higher temperature, greater surface area or a catalyst when reactant amounts are unchanged. It is not consistent with simply doubling the limiting reactant, which should increase the theoretical plateau. Before accepting the conclusion, check that both syringes were airtight and had adequate capacity.
Common misconceptions and corrections
Defining rate only as time taken. Rate is change per unit time.
Saying a longer endpoint time means faster. The same endpoint is reached more slowly.
Using reciprocal time without a common endpoint. The comparison then lacks a shared basis.
Collecting gas in a fixed sealed vessel. Pressure can rise dangerously.
Sealing a mass-loss flask. Gas must escape for mass to decrease.
Assuming every mass loss is product gas. Evaporation or spray may contribute.
Ignoring gas loss while fitting the bung. Early readings and initial rate are affected.
Starting timing after the apparatus is sealed. The reaction has already progressed.
Taking only a final reading. This cannot define the curve or initial rate.
Joining graph points dot to dot. Use a suitable best-fit curve.
Calculating initial rate from the whole curve. Use a tangent near time zero.
Using a tiny tangent triangle. A large triangle reduces reading uncertainty.
Calling a negative mass gradient a negative reaction rate. Compare the magnitude of mass decrease.
Saying a plateau means all reactants are gone. It means the measured quantity no longer changes.
Assuming steeper curves must have higher plateaus. Rate and total amount differ.
Changing concentration without considering total moles. Both slope and plateau may change.
Using unequal solid masses for surface-area comparison. This introduces another variable.
Saying powder particles themselves are larger. Powder has smaller particles and greater total surface area.
Explaining temperature only with more collisions. A larger successful fraction is also required.
Saying a catalyst gives particles more energy. It lowers activation energy through another pathway.
Saying a catalyst increases final product amount. It changes rate, not the stoichiometric maximum.
Removing anomalies because they look inconvenient. Exclusion needs experimental evidence.
Calling repeats a control. Repeats measure reliability; a control gives a baseline.
Assessment guidance
Planning answers should define a measurable dependent variable, a useful independent-variable range, operational controls, a reproducible start and independent repeats. Graph questions need labelled axes, sensible scales, an appropriate best-fit line and gradients with units. When comparing curves, discuss both slope and plateau rather than saying only “faster.” Collision explanations must link particle conditions to collision frequency or successful-collision fraction and activation energy. Evaluation answers should predict the direction of error and propose an apparatus-specific correction. Distinguish a no-catalyst control from repeated trials and distinguish initial rate from average rate.
Retrieval practice
Design concentration, temperature, surface-area and catalyst investigations from blank apparatus lists. Draw gas-syringe and mass-loss setups, then diagnose twelve faults. Convert repeated endpoint times into comparative rates. Plot four full time series, draw initial tangents and calculate gradients with units. Interpret paired slopes and plateaus, explain each with collision theory and write limitation-effect-improvement chains for leaks, start delay, evaporation, temperature drift, particle-size variation and subjective endpoints.
Theory and practical ownership
This practical note owns rate signals, setup, variables, timing, tables, graphs, gradients, method comparison, safety and evaluation. The Chemistry theory hub owns activation-energy and collision-theory development beyond the evidence chain used here.