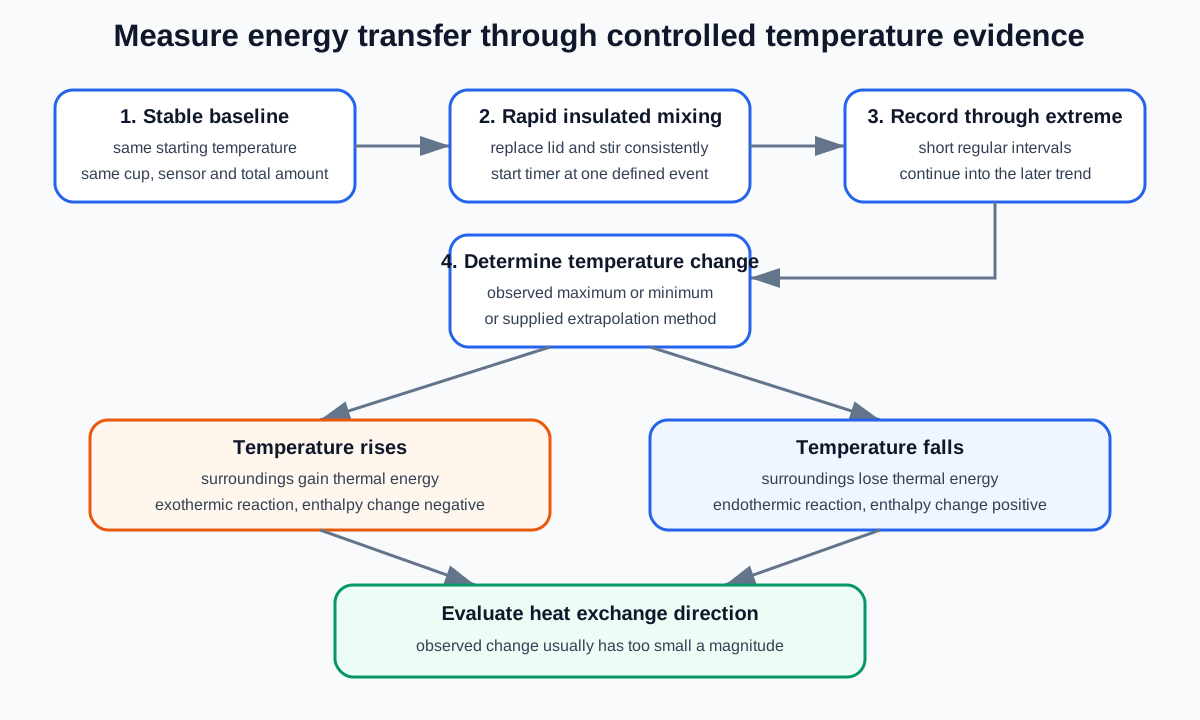
Practical Skill 8 develops temperature-change evidence for Cambridge IGCSE Chemistry section 5.1 and the shared practical contexts for reaction temperature changes and heating or cooling curves. The central task is to measure the surroundings reliably, classify energy transfer correctly and evaluate why the observed temperature change is usually smaller than the ideal change.
Interpret the thermometer reading correctly
An exothermic reaction transfers thermal energy to the surroundings, so the measured solution and container usually warm. An endothermic reaction takes in thermal energy from the surroundings, so they usually cool.
The thermometer measures part of the surroundings, not the reacting particles' internal energy directly. A temperature rise supports exothermic transfer under the stated setup. A temperature fall supports endothermic transfer.
Use a signed change when the question requires it:
temperature rise: final or maximum temperature minus initial temperature
temperature fall: final or minimum temperature minus initial temperature, giving a negative value
If only the magnitude is requested, report the positive size of the change and state the direction separately.
Do not transfer the sign of temperature change mechanically to enthalpy change. Exothermic reactions have negative enthalpy change even though the surroundings' temperature change is positive.
Choose a low-heat-loss setup
Use an insulated cup supported in a beaker for stability. Fit a lid with openings for a thermometer or temperature probe and a stirrer. The lid reduces heat transfer and evaporation while allowing measurement.
The temperature sensor bulb should be immersed in the reacting mixture without touching the cup wall or base. Contact with the container can make the reading respond to a local surface rather than the well-mixed liquid.
Choose a thermometer range that includes the expected extreme and a resolution fine enough to distinguish trials. A digital probe with logging can capture a brief maximum or minimum, but it still needs correct placement and calibration.
Measure volumes with apparatus appropriate to the required precision. For fair comparisons, the same cup, lid, sensor and measuring method should be used throughout.
Establish a stable baseline
Reactants should begin at the same known temperature or have their separate temperatures recorded as the method specifies. If two solutions begin at different temperatures, choosing only one as the initial temperature biases the calculated change.
Check this topic from memory
Attempt the matching topic bank before reopening the notes. Use each missed idea to decide what to review next.
Allow solutions and the cup to equilibrate in the same room or controlled water bath. Record several baseline readings at fixed intervals before mixing. A steady baseline gives stronger evidence than one isolated reading.
When equal volumes of similar aqueous solutions begin at slightly different temperatures, a question may direct use of a mean starting temperature. Do not invent this correction without the stated assumptions.
Mix and measure reproducibly
Place the first measured reactant in the insulated cup.
Record the stable initial temperature.
Add the second reactant rapidly and start the timer at the same event.
Replace the lid immediately.
Stir at a consistent gentle rate.
Record temperature at short regular intervals through the maximum or minimum and into the later trend.
Rinse and restore the apparatus to the same starting condition before repeating.
Rapid transfer and immediate lid replacement reduce unmeasured heat exchange. Consistent stirring distributes energy and prevents the sensor sampling a hot or cold region.
Do not stop at the first changed reading. Continue beyond the extreme so the curve shape shows whether the peak or trough has truly passed.
Plan a fair comparison
Possible independent variables include reactant identity, concentration, amount or mixing ratio. Define exact values and a safe range.
The dependent variable is normally maximum temperature rise, maximum temperature fall or a value corrected by a supplied graph method.
Control:
initial temperature
total solution volume or mass
identity and amount of the non-varied reactant
concentration except when it is changed
cup, lid and sensor
addition order and transfer time
stirring rate and duration
reading interval and extreme-temperature rule
room conditions
State how each is held constant. Equal total volume matters because a larger mass of solution requires more energy for the same temperature change.
When varying mixing ratio to find a maximum temperature, keep total volume constant. This separates composition from changing heat capacity more effectively.
Record a temperature-time series
Use a table headed time and temperature with units. Include readings before and after mixing, and identify the mixing time clearly.
Preserve sensor precision. Record 24.0 degrees Celsius when the instrument displays one decimal place rather than changing between 24 and 24.00.
Plot time horizontally and temperature vertically. Use sensible scales and a smooth best-fit trend. Mark the mixing time rather than disguising it as an ordinary reading.
For direct comparisons, calculate temperature change from the same defined initial and extreme points. Repeating only one condition does not establish the reliability of every comparison.
Use maximum or minimum evidence carefully
In an exothermic run, the observed maximum may occur after mixing because transfer from reacting particles to solution and sensor response take time. Heat loss begins immediately, so the recorded maximum can still underestimate the no-loss value.
In an endothermic run, heat flows into the cold mixture from the surroundings. The recorded temperature fall is therefore usually smaller in magnitude than it would be in perfect insulation.
The cup and sensor also absorb or release energy. Treating only the solution as the surroundings ignores their heat capacity and normally contributes to underestimating the reaction's energy-transfer magnitude.
Apply a supplied cooling correction
Some questions provide a temperature-time graph and ask for extrapolation. Plot the pre-mixing baseline and the post-reaction cooling or warming trend. Extend the appropriate best-fit lines to the mixing time. The vertical separation estimates the corrected temperature change.
Extrapolate a trend, not a zigzag through every point. Use points from a region with an approximately steady heat-transfer pattern and show construction lines clearly.
Correction reduces the effect of post-mixing heat exchange, but it does not remove reagent-transfer loss, thermometer calibration error, incomplete reaction or invalid heat-capacity assumptions.
Interpret heating and cooling curves
For a substance heated or cooled through a change of state, plot temperature against time. Sloping regions show temperature changing within a state. A plateau or reduced slope around melting, boiling, freezing or condensing indicates energy transfer associated with change of state.
During a pure substance's ideal change of state, temperature remains constant while particle arrangement and separation change. Real school data may show a tilted or rounded region because of heat loss, impurities, sensor lag or non-uniform temperature.
Do not describe a plateau as “no energy transfer.” Energy is transferred while temperature remains approximately constant.
Process energy data only when supplied
A question may provide the relationship between transferred energy, mass, specific heat capacity and temperature change. Substitute the mass of the material being modelled, use consistent units and state the assumptions.
If solution density is supplied or explicitly approximated, volume may be converted to mass. Do not assume every solution has water's density or specific heat capacity without permission.
For an energy-per-mole value, identify the limiting reactant and divide by its reacting amount in moles. Convert joules to kilojoules where required. Apply the reaction sign only after classifying exothermic or endothermic transfer.
The official IGCSE theory boundary emphasises classification and enthalpy sign rather than requiring a universal calorimetry formula, so follow the data and relationships given in the question.
Compare evidence without overclaiming
A larger observed temperature rise in a controlled setup supports more thermal energy transferred to comparable surroundings. It does not by itself prove a larger molar enthalpy change if reacting moles, solution mass or heat capacity differ.
A near-zero observed change does not prove no energy transfer. Opposing processes, small quantities, poor resolution or rapid exchange with the room can conceal a change.
Report repeat variability. A mean is useful only after anomalous trials are investigated, not deleted because they differ from expectation.
Evaluate by energy-flow direction
Poor insulation lets an exothermic mixture lose energy to the room, lowering its observed maximum. Use nested insulated cups and a lid.
The room warms an endothermic mixture, raising its observed minimum and reducing fall magnitude. Improve insulation and shorten transfer delay.
Slow sensor response misses a brief extreme. Use shorter intervals or a suitable logging probe.
Inconsistent stirring creates temperature gradients. Use the same gentle stirring method without splashing.
Different starting temperatures invalidate direct comparison. Equilibrate reagents together before each trial.
Different total volumes change heat capacity. Hold total amount constant or process energy with justified heat-capacity data.
Material left in a measuring cylinder may leave reaction incomplete. Rinse quantitatively only if the added rinse does not change the designed total volume; otherwise use consistent drain time and acknowledge transfer loss.
Safety
Wear eye protection and use the specified dilute quantities. Support the insulated cup so it cannot tip, replace the lid without forcing the sensor and stir without puncturing the cup.
Strong acids, alkalis or oxidising reagents may be corrosive or irritating; follow the supplied hazard information and avoid skin contact. Exothermic mixtures and heated water baths can burn, so keep quantities small and allow apparatus to cool. Do not use a naked flame near flammable substances.
Worked application: compare neutralisation trials
Two equal-volume trials start at 22.0 degrees Celsius. Trial A reaches 31.5 degrees Celsius, so its temperature rise is 9.5 degrees Celsius. Trial B reaches 27.8 degrees Celsius, a rise of 5.8 degrees Celsius. If both use the same insulated cup, total solution volume, starting temperature and reacting amount, A transfers more thermal energy to comparable surroundings. The data alone do not establish a larger molar enthalpy change if those quantities differ. Heat loss means both observed rises probably underestimate ideal values. Repeating each trial and extrapolating a justified post-peak cooling trend would strengthen the comparison.
Common misconceptions and corrections
Saying the thermometer measures the reaction's internal energy. It measures the surroundings' temperature.
Calling every temperature rise endothermic because the reaction gains heat. A rise in surroundings supports exothermic transfer.
Giving exothermic enthalpy change a positive sign. Exothermic enthalpy change is negative.
Using one reactant's temperature when starting temperatures differ. Follow a justified shared-baseline method.
Leaving the cup unsupported. It can tip during addition or stirring.
Leaving the lid off. Heat transfer and evaporation increase.
Letting the sensor touch the cup wall. It may not represent bulk solution temperature.
Recording only initial and one final reading. The true extreme may be missed.
Stopping at the first maximum-looking value. Continue to confirm the trend.
Stirring differently between trials. Temperature uniformity and heat loss change.
Comparing different total volumes directly. Their heat capacities differ.
Changing concentration and reacting moles unintentionally. Define the design and controls.
Assuming the observed maximum is the no-loss maximum. Heat exchange begins immediately.
Saying heat loss always lowers temperature. The room warms an endothermic mixture.
Drawing cooling correction through every point. Use an appropriate best-fit trend.
Claiming extrapolation removes every error. It addresses only part of heat exchange.
Calling a phase-change plateau no energy transfer. Energy changes particle arrangement.
Assuming a real plateau must be perfectly horizontal. Impurities and heat transfer can distort it.
Using solution volume as mass without an allowed density. State the supplied conversion.
Assuming every solution has water's heat capacity. The model needs justification.
Dividing energy by total moles rather than reacting limiting moles. Use the stoichiometric basis.
Calling a larger temperature rise automatically a larger molar enthalpy. Amount and heat capacity matter.
Treating repeats as a control condition. Repeats assess reliability.
Assessment guidance
Method answers should specify insulation, lid, sensor position, stable starting temperature, rapid mixing, consistent stirring and readings through the extreme. Comparison answers must control total amount and starting conditions before interpreting temperature change. Graph questions should label mixing time and show justified extrapolation rather than point-to-point extension. Explanations must distinguish surroundings temperature from reaction enthalpy sign. When processing supplied energy data, state mass and heat-capacity assumptions and use limiting moles. Evaluation should name the direction of heat exchange and its effect on the observed maximum or minimum, followed by a targeted apparatus improvement.
Retrieval practice
Draw and label an insulated-cup setup, then diagnose twelve faults. Plan fair identity, concentration and mixing-ratio comparisons. Complete temperature-time tables and calculate signed changes. Plot exothermic, endothermic, heating and cooling curves; mark extremes, mixing times and phase-change regions. Practise supplied cooling corrections and energy calculations, then write limitation-effect-improvement chains for insulation, sensor lag, starting temperature, total volume, stirring and transfer loss.
Theory and practical ownership
This practical note owns temperature-change setup, variables, time series, extremes, graph correction, heating and cooling evidence, safety and evaluation. The Chemistry theory hub owns pathway diagrams, activation energy, bond breaking and making, and bond-energy calculations.