A graph is a structured argument, not a decorative curve. Its intercepts, symmetry, end behavior, asymptotes and stationary points encode algebraic facts. Pearson International GCSE Further Pure Mathematics (4PM1) expects you to recognise standard graphs, transform them, locate intersections, and use sketches to solve equations or inequalities. A credible sketch need not be drawn to scale, but every labelled feature must agree with the function's domain and behavior.
1. Build a sketch from features
Before drawing, identify the graph family and make a feature list. Useful questions are:
What values of x are allowed, and what outputs are possible?
Where does the graph meet either axis?
Are there asymptotes, turning points or points of inflection?
Is the graph even, odd, periodic or otherwise symmetric?
What happens as x becomes very large, very negative or approaches an excluded value?
A polynomial is defined for every real x and has no vertical asymptote. Its leading term controls end behavior. An even-degree polynomial has ends moving in the same direction; an odd-degree polynomial has ends moving in opposite directions. Real roots locate horizontal-axis intersections. A repeated root of even multiplicity usually gives tangency, while an odd-multiplicity root gives a crossing.
The reciprocal graph y = 1/x has domain and range excluding zero, with asymptotes x = 0 and y = 0. Its branches occupy the first and third quadrants. The graph y = 1/x² is positive and even, so its branches occupy the first and second quadrants. An asymptote describes limiting behavior. The curve may approach it indefinitely without meeting it in the standard reciprocal cases; do not join branches through an excluded input.
For a base a > 1, y = aˣ is positive, increasing, passes through (0, 1) and approaches the horizontal asymptote y = 0 as x decreases. Its inverse y = loga
Check this topic from memory
Attempt the matching topic bank before reopening the notes. Use each missed idea to decide what to review next.
, both monotonic directions reverse, but their domains and inverse relationship remain.
2. Translations
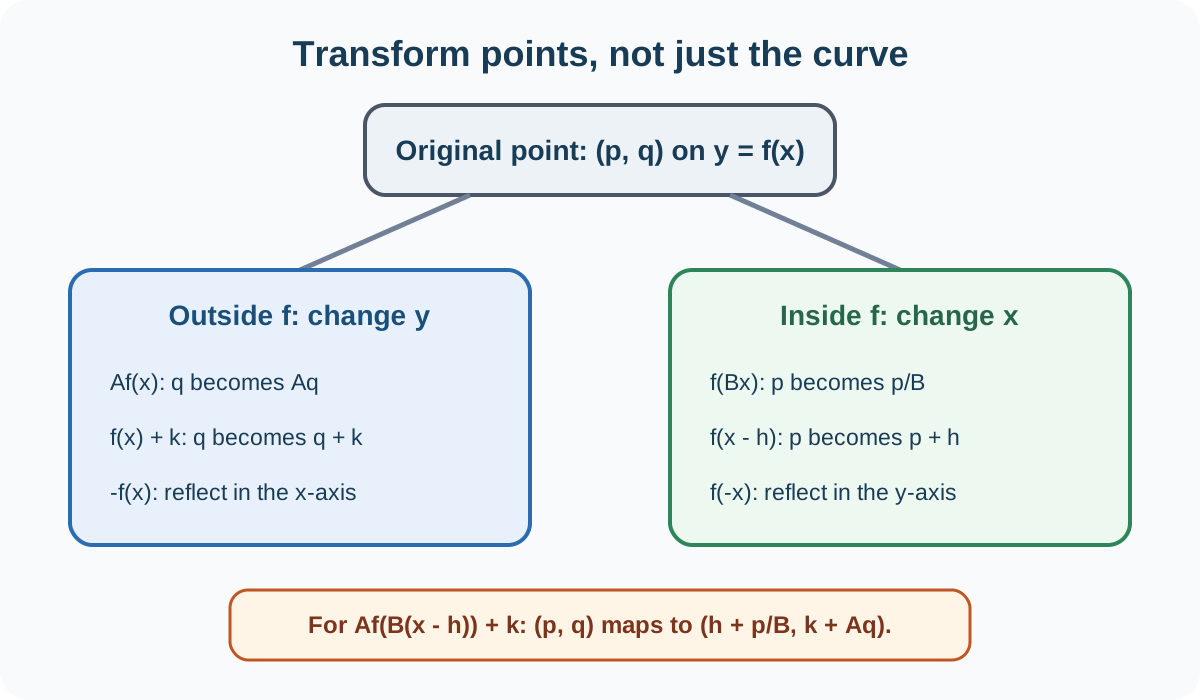
If y = f(x) is known, then y = f(x) + k translates it vertically by vector (0, k). Every output changes by k, so horizontal asymptotes and the range move with the graph. The graph y = f(x - h) translates horizontally by vector (h, 0). The direction inside the argument appears reversed because an original input u is now reached when x - h = u, or x = u + h.
Track a known point to avoid memorisation errors. If (p, q) lies on y = f(x), then (p + h, q + k) lies on y = f(x - h) + k. A vertical asymptote x = a becomes x = a + h, while a horizontal asymptote y = b becomes y = b + k.
When transformations are combined, identify the point mapping rather than performing vague visual moves. For y = Af(B(x - h)) + k, a point (p, q) maps to (h + p/B, k + Aq), provided A and B are non-zero. This mapping also reveals reflections when either multiplier is negative.
3. Stretches and reflections
The graph y = Af(x) multiplies every vertical coordinate by A. If |A| > 1, it is a vertical stretch; if 0 < |A| < 1, it is a vertical compression. A negative A also reflects the graph in the horizontal axis.
The graph y = f(Bx) changes horizontal coordinates by the factor 1/B. This reciprocal scale is a frequent source of errors. If |B| > 1, the graph is compressed horizontally; if 0 < |B| < 1, it is stretched. A negative B reflects the graph in the vertical axis.
The transformation y = f(-x) reflects in the vertical axis, while y = -f(x) reflects in the horizontal axis. These are identical only for particular symmetric functions. Check which coordinate changes sign.
Absolute values create two further transformations. The graph y = |f(x)| reflects any portion below the horizontal axis upwards, because outputs become non-negative. The graph y = f(|x|) keeps the right-hand part for x ≥ 0 and reflects that part into the left half-plane. The latter always produces an even graph on a symmetric domain.
4. Intersections and graphical equations
An intersection of y = f(x) and y = g(x) satisfies f(x) = g(x). The horizontal coordinate is a simultaneous solution; substitute it into either function to obtain the vertical coordinate. A tangent intersection corresponds to a repeated solution of the rearranged equation, whereas crossings normally correspond to sign changes.
To solve f(x) = c graphically, intersect y = f(x) with the horizontal line y = c. To solve f(x) = mx + c, use the intersection with that line. A parameter can shift the line and change the number of solutions. State whether there are zero, one or several solutions and quote estimates only to the precision justified by the graph.
Graphical inequalities compare vertical positions. The solution of f(x) > g(x) consists of horizontal-coordinate intervals where the graph of f lies above the graph of g. Mark the intersection coordinates first, then inspect the regions between them. Strict inequalities exclude equality points; non-strict inequalities include them if both functions are defined there.
5. Domain, range and inverse structure
Domain restrictions must survive transformations. If f accepts only positive inputs, then f(x - 3) requires x - 3 > 0, so its domain is x > 3. For a reciprocal expression, denominator zeros create vertical asymptotes or holes. For a square root, its radicand must be non-negative in a real-valued graph.
The range can often be read from a turning point or asymptote. For y = (x - 2)² - 5, the minimum is -5, so the range is y ≥ -5. For y = 3 + 2/(x - 1), the output cannot equal 3, so the range excludes 3.
A function has an inverse function on a domain only if it is one-to-one there. The horizontal-line test identifies this graphically. Restricting a quadratic to one side of its turning point can make it invertible. The inverse graph is the reflection in y = x, which swaps domain and range as well as every point's coordinates.
Worked example: transform, asymptotes and intersections
Starting from y = 1/x, sketch g(x) = 2/(x - 3) + 1 and solve g(x) = 3. The replacement x → x - 3 moves the reciprocal graph three units right, multiplication by 2 stretches vertical coordinates by factor 2, and adding 1 moves it one unit up. Therefore the vertical asymptote is x = 3 and the horizontal asymptote is y = 1. The domain excludes 3 and the range excludes 1. To locate the requested intersection, solve 2/(x - 3) + 1 = 3. Subtracting 1 gives 2/(x - 3) = 2, so x - 3 = 1 and x = 4. The intersection is (4, 3). A quick substitution gives 2/1 + 1 = 3. The second branch has no further intersection with y = 3, which agrees with the algebra's single solution.
Common misconceptions and how to correct them
Moving horizontally in the sign shown inside the function. Track a known point: f(x - h) moves it right by h.
Using the multiplier inside a function as the horizontal scale factor. For f(Bx), horizontal coordinates scale by 1/B.
Reflecting the wrong coordinate. A minus outside changes outputs and reflects in the horizontal axis; a minus inside changes inputs and reflects in the vertical axis.
Drawing through a vertical asymptote. The corresponding input is excluded, so keep the branches disconnected and label the asymptote.
Moving only the curve but not its asymptotes. Asymptotes are features of the transformed graph and translate appropriately.
Assuming every intersection is a crossing. Tangency gives an intersection without a sign change and often a repeated algebraic solution.
Reading an inequality from left and right rather than above and below. Compare the vertical positions of the two graphs on each interval.
Reporting excessive precision from a sketch. Match decimal places to the grid and plotting accuracy supplied.
Assessment guidance
Plan a sketch by listing domain, intercepts, asymptotes, stationary points, symmetry and end behavior before drawing. Label exact features where algebra provides them and use dashed guide lines for asymptotes. In transformation questions, state each operation and map at least one known point; this makes direction and scale errors visible. When solving graphically, identify the two curves or the comparison line and record all intersections within the displayed domain. For inequalities, translate “greater than” into “lies above” and give intervals with correct endpoint inclusion. If the question requests an estimate, show any construction used and avoid unsupported accuracy. Finally, test the sketch against the function: no point may violate its domain, range or limiting behavior.
Retrieval practice
Sketch the base reciprocal, exponential and logarithmic graphs from memory, labelling intercepts and asymptotes. Then map a point (p, q) under y = Af(B(x - h)) + k. Explain the difference between |f(x)| and f(|x|), and use two intersecting graphs to describe both an equation and an inequality solution.