

Pearson Edexcel International GCSE Mathematics B 10: Statistics and probability
Pearson Edexcel International GCSE Mathematics B 4MB1 notes on statistics and probability.
Statistics summarizes observed data, while probability models uncertain outcomes. Pearson Edexcel International GCSE Mathematics B (4MB1) includes bar charts, pie charts and histograms; mean, median and mode for discrete data; estimated mean, modal class and median class for grouped data; probability language, sample spaces, relative frequency and complements; addition for mutually exclusive events; products and trees for independent events; simple conditional probability without conditional notation; and expected frequency. Cumulative-frequency graphs, weighted means and moving means are excluded.
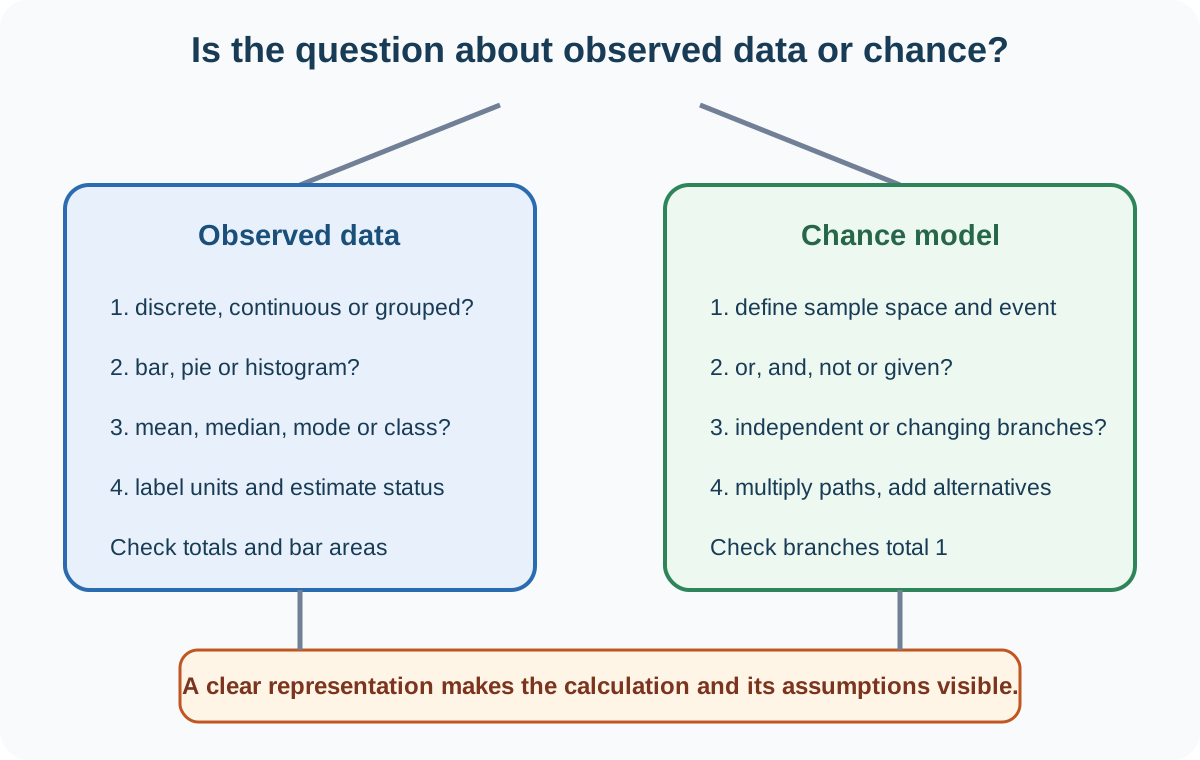
1. Data and representation
Numerical data may be discrete, taking separate countable values, or continuous, taking any value in an interval. Categorical data records labels rather than numerical magnitude. The representation should match the data and question.
A bar chart uses separated bars for categories or discrete values. Bar height represents frequency unless another scale is stated. A pie-chart sector angle is
(category frequency/total frequency) × 360°.
Sector angles should total 360°, apart from rounding. Convert an angle back to frequency using the same proportion.
A histogram represents grouped continuous data with touching bars. When class widths differ, bar height is frequency density:
frequency density = frequency/class width.
Bar area, not height alone, represents frequency. To recover frequency, multiply density by class width. Axes need class boundaries rather than ambiguous labels.
Pearson excludes cumulative-frequency graphs from this topic. Do not present them as required even though they appear in other mathematics specifications.
2. Mean, median and mode
For a discrete data set, the mean is total of values divided by number of values. With a frequency table,
mean = Σ(fx)/Σf.
The median is the middle value after ordering. For an odd number n, it is position (n + 1)/2. For an even number, average positions n/2 and n/2 + 1. In a frequency table, use cumulative counts mentally or explicitly to locate these positions.
The mode is the most frequent value. A data set may have more than one mode or none if all frequencies tie. Do not confuse mode with the largest numerical value.
The mean uses every value and is sensitive to extremes. Median is resistant to outliers. Mode identifies the most common observed value. Choose a summary appropriate to context rather than assuming mean is always best.
3. Grouped data
Check this topic from memory
Attempt the matching topic bank before reopening the notes. Use each missed idea to decide what to review next.
Start the topic quiz