

Pearson IGCSE Physics Practical 4: Conclusions, Evaluation and Improvements
Evaluate Pearson International GCSE Physics investigations with uncertainty-aware conclusions and improvements.
Evaluation tests whether the evidence supports the proposed physical model within measurement limits.
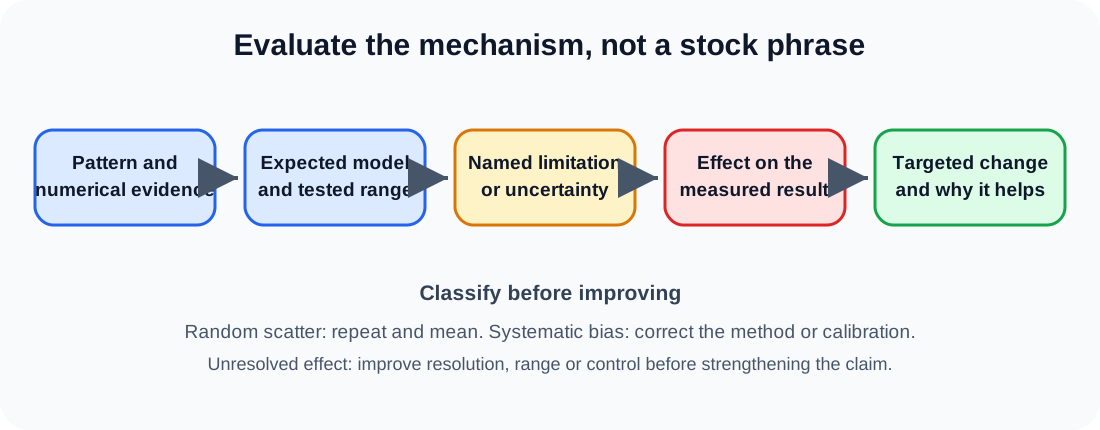
In Pearson 4PH1, a strong evaluation links four things: the observed evidence, the expected physical relationship, a named limitation and an improvement that acts on that limitation. Generic criticism is not enough. The evaluator must explain how the method could have produced the pattern, scatter or bias seen in the results.
Evaluation method
- Describe proportionality, curvature, threshold or trend using data.
- Compare the observed pattern with the model and discuss anomalies separately.
- Identify random scatter, systematic offset and uncontrolled energy loss.
- Explain how each limitation changes the measured quantity.
- Propose a specific improvement, such as insulation, automated timing or a wider measured range.
- Avoid claiming exact agreement when uncertainties overlap only approximately.
Write the conclusion from evidence
Begin with the relationship shown by the data, not the prediction. State whether the dependent variable increases, decreases, remains constant, reaches a plateau or changes gradient as the independent variable changes. Support the description with a numerical comparison, gradient, intercept or range. If the graph is straight and passes through the origin within the plotting uncertainty, the quantities may be directly proportional over the tested range. A straight line with a non-zero intercept is only linear.
Restrict the claim to what was tested. Six points below a spring's limit of proportionality do not prove that Hooke's law applies at all forces. A small cooling interval does not establish the shape of the entire cooling curve. Experimental evidence supports, is consistent with or does not support a model; it rarely proves a universal law.
Separate scatter, anomaly and systematic bias
Random variation makes repeated readings differ unpredictably. It can come from human reaction time, fluctuating meter readings, variable release or limited scale interpolation. Repeats and a mean reduce its influence and expose the spread. A single result should be called anomalous only if it is inconsistent with repeats or the otherwise supported trend. Investigate or repeat it rather than deleting it automatically.
A systematic error shifts readings in a consistent direction. Examples include a zero offset, a ruler positioned away from the measurement plane, heat loss in every calorimetry trial or a sensor with incorrect calibration. Repeats do not remove such bias. A graph intercept can suggest a zero offset, but the physical model and uncertainty must also be considered.
Check this topic from memory
Attempt the matching topic bank before reopening the notes. Use each missed idea to decide what to review next.
Start the topic quiz